


Are Remaining Carbon Budgets still relevant?
The latest estimate of the Remaining Carbon Budget says we can emit another 6 years worth of today’s CO2 emissions and stay below +1.5ºC. Given the latest climate data, how can this possible be true?

Data are now showing that climate change is accelerating beyond expectation with growing threats to nature, human life and society. Decades ago it was hard to separate the climate change signal from natural variability. Computational models were heavily relied on. As the signal becomes ever clearer, this is no longer the case. With each report, anticipated risks are increased and move nearer in time. This is helped by new data, analytical capabilities, improved instrumentation and actual climate results to fine-tune these projections. Computational models now appear conservative, underestimating the pace of the observed warming.
The Remaining Carbon Budget (the amount of carbon that can be emitted while staying under the Paris Agreement targets), which relies heavily on models, is one of the victims of this conservative outlook. Up to date energy accumulation measurements cast significant doubt on these projections, suggesting we have already exceeded this theoretical limit.
The Paris Agreement commits the world to limiting global temperatures to well below 2°C above pre-industrial levels and pursue efforts to limit the temperature increase to 1.5°C. The current trajectory shows that +3ºC is the more likely outcome but that still requires us to achieve net-zero and scale up carbon removal technologies by the second half of the century.
CO2 emissions are the main focus, they are the primary force behind the warming. This leads to an assumption that there are specific emission totals that cause a particular level of warming, but there is more to it than that. At the end of the day it all comes down to the accumulating energy in the Earth’s system. When that is examined, the situation and implications become much clearer.
Earth’s Energy Imbalance and Accumulation
For nearly 25 years, the NASA CERES satellites1 have been measuring the Earth’s Energy Imbalance (EEI). This is the difference between the incoming energy from the sun and the outgoing energy from reflection and re-radiation back into space. An EEI of zero means the ‘system’ is in balance and the climate remains stable. A positive EEI means the Earth is accumulating energy, so it warms up. A negative EEI means the Earth is losing energy, so it cools down. The graph below shows the CERES data as a 3 year moving average. Not only is it positive, it is getting larger and larger, leading to accelerating warming in all components of the Earth system.
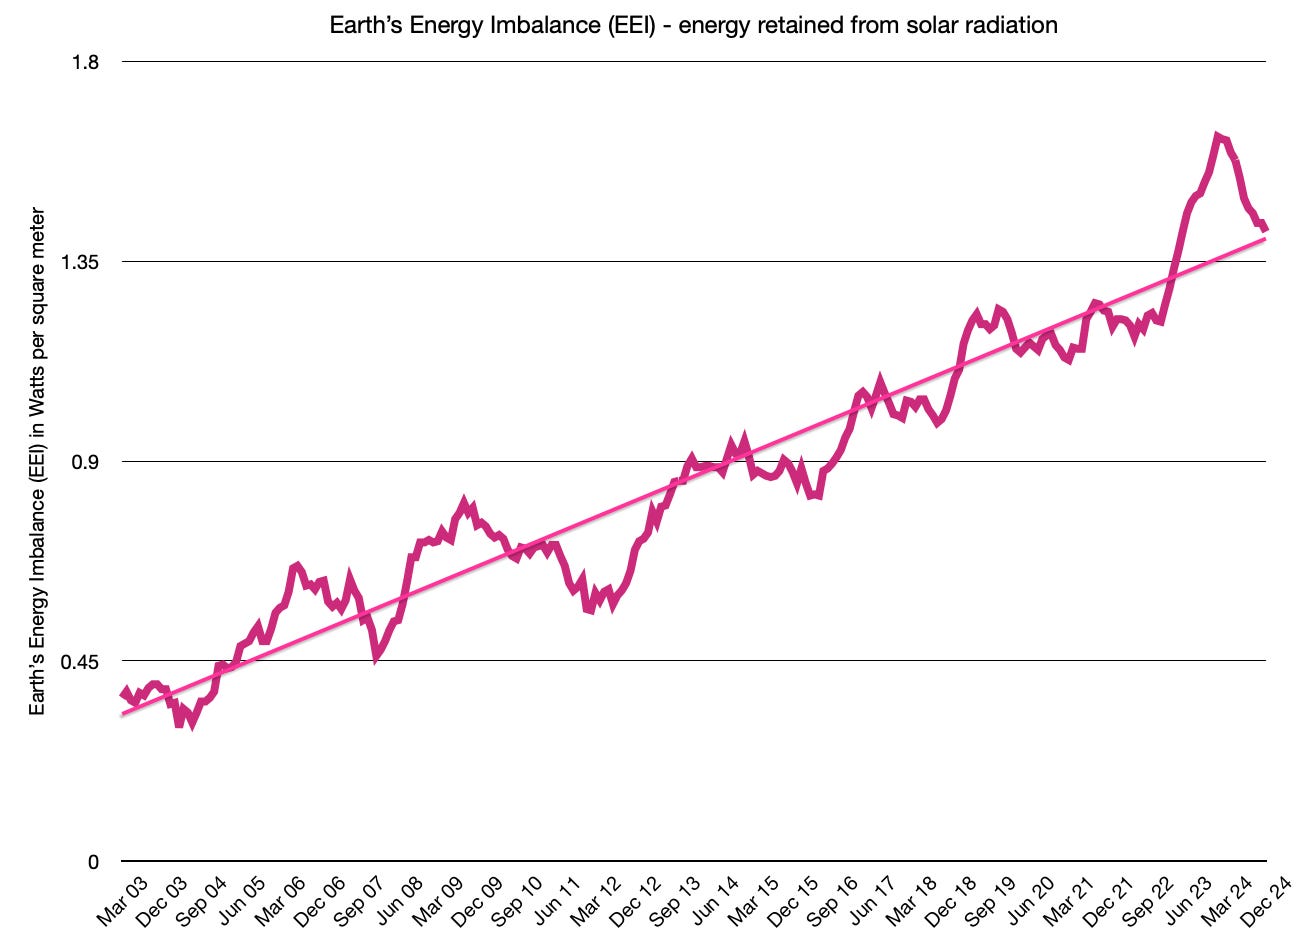
The units are in watts per square meter of the Earth surface. There are 510,000,000,000,000 square meters, so this adds up to a lot of energy. Another commonly used scale is Hiroshima Bomb blasts per second. The current level of 1.4w/m2 equates to the heat from 12 Hiroshima bombs going off every single second. If you prefer a less violent analogy, it’s as if every human on Earth, all 8.2 billion of us, we're continually using 60 electric kettles each to warm the oceans.
The EEI is the total effect, or the end net result, of all the various forces that act on the climate system, both positive (warming) and negative (cooling). It includes greenhouse gas forcing which is positive, aerosol reflection and cloud brightening forcings which are negative, volcanic eruptions which tend to be initially negative due to aerosol ejection, but longer term positive due to CO2 outgassing. It includes changes in albedo from melting ice and cloud distribution changes which reflect less sunlight and so on.
EEI has the advantage that being the end result and a physical measurement it contains everything. Many models are inhibited by not including elements that are not understood well enough, such as ice sheet fracture dynamics or tipping point triggers.
Adding EEI up over time, we can look at the Earth Energy Accumulation (EEA). A watt is 1 joule of energy per second. Over the last 40 years, every square meter has accumulated about 1GJ of energy. Since the CERES era, the earth has accumulated over 320ZJ of energy (One zettajoule is 1021 Joules). Looking at the CERES EEA graph, the acceleration in energy accumulation is clear. It’s obvious why all the climate change indicators such as temperatures, ice melt, loss & damage etc. are accelerating2.

So what did the Earth system do with all that additional energy? According to the IPCC AR6 report of 20213, only 1% of the accumulated heat went towards warming the atmosphere. 3% was used to melt ice, 5% was used warming the land surfaces, but the vast majority, 91% warmed the oceans.
To prove that the EEA is indeed driving the warming, Merchant et al4 decomposed the observed global mean sea surface temperature into the various drivers including EEA, the El Niño / La Niña fluctuations in the Pacific Ocean, volcanic activity and solar cycle variations. The EEA is clearly the cause of the observed accelerating temperature trend, while El Niños and volcanos merely create temporary fluctuations.
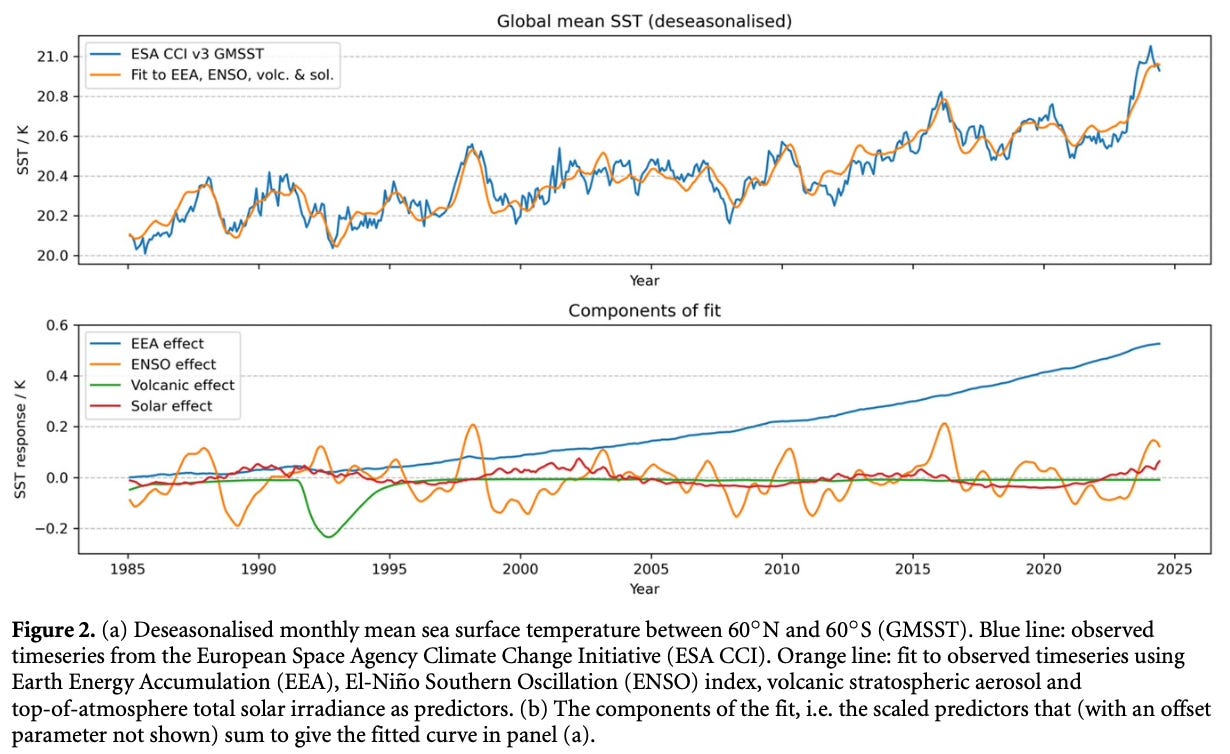
The signal is very clear for ocean heating as it accounts for 91% of the accumulated energy, but the same curve is visible in the atmospheric temperature and rate of ice melt. The 5% going to land surface warming is also why air temperatures over continents are growing faster than the global average. The Copernicus European State of the Climate 2024 report5 for example, states that Europe has warmed by +2.4ºC since pre-industrial.
The accumulated energy to date is the combination of all the greenhouse gas emission forcing plus all the various feedbacks, both positive and negative. The accumulated energy has been sufficient to warm the atmosphere by 1.45ºC by the end of 2024, rapidly approaching the +1.5ºC Paris stretch target.
The energy required to do this is unimaginably high, but remember it was only 1% of the accumulated energy. Three times as much energy has gone into melting the world’s ice caps, glaciers and permafrost. No wonder they are disappearing so quickly. The oceans though, are the main absorbers of this heat and are changing rapidly as a result, threatening coral reef extinction in the near future and driving increasingly frequent and violent tropical storms.
Equilibrium and ‘pipeline’ effects
Climate responses to this accumulation of energy vary in the amount of time required to fully take effect. Some are very fast, such as the air’s ability to hold water vapour. Warm air flowing over a moist surface will allow a level of evaporation depending on its temperature at that exact time. Ice sheet melt water entering ocean currents will take much longer to have an effect on deep water circulation patterns and global heat transfer, decades even.
Returning the EEI to zero is the only way to stop global warming. Only by stopping excess energy building up can the feedback processes reach an equilibrium. Since the EEI is a combination of GHG forcing and feedbacks, achieving net-zero emissions only stops part of the problem. After net-zero, the feedbacks need time to reach an equilibrium or stable state. Only then will the accumulation of energy stop and the warming stop with it.
The strongest current feedback is Earth’s albedo. This is the shininess or reflectiveness of the surface to the incoming solar radiation. The major reflective surfaces are clouds and ice. Various different landscapes also contribute, but are less variable and don’t tend to have associated feedbacks.

Albedo has been dropping steadily during the CERES era and is actually the largest and fastest growing positive EEI forcing. It’s not known how much more this self-reinforcing feedback has to go before it stabilises. Continued albedo reduction leads to continued energy accumulation, which in turn leads to continued reduction and so on. This will not stop instantly with net-zero emissions, but require time to stabilise. The remaining warming during the time after net-zero has become known as pipeline warming6.
Cloud albedo reduction has two currently known drivers. Recent aerosol pollution reduction measures have had an effect on cloud formation and brightness. Cloud area is also dropping. A 2024 paper by George Tselioudis et al7 revealed the cloud cover reduction over the Pacific and Atlantic Oceans over the last 40 years, making a large contribution towards the drop in albedo.
The diagram is unusual, but depicts the cloud cover for each latitude over time. Each vertical colour bar is one year’s average cloud cover for each degree of latitude from the south pole at the bottom to the north pole at the top. As time progresses to the right, it’s clear how the red high cloud cover bands are shrinking and the blue, low cloud cover areas are expanding. Where there was up to 80% Atlantic cloud cover between the equator and 10º North in 1985, there is less than 65% by 2020. This will have a significant effect on albedo and therefore heat input as a result.

The hope is that if net-zero is achieved, the remaining pipeline warming will be offset by a reduction in atmospheric CO2 as the oceans and biosphere continue to absorb it. This may keep the EEI to zero preventing further energy accumulation, but it won’t stop slow feedbacks such as ice sheet melt and sea level rise which will continue for thousands of years.
This hope of stopping global warming at net-zero was however partly based on the understanding that as concentrations of CO2 rose, absorption would speed up to match it. Recently however, it’s been shown that natural sinks are actually declining as the planet warms8. 2024 saw the highest annual increase in atmospheric concentrations and in the last week the 430ppm threshold was breached. Methane and nitrous oxide are also at record highs.
Implications for future warming
1.5ºC
Given the fact that the average temperature for the last 30 months (including the whole of 2024) has exceeding 1.5ºC above pre-industrial, that the smoothed polynomial temperature trend has us at +1.45ºC by the end of 2024, EEA is accelerating and feedbacks such as albedo decline are still strengthening, stopping warming at the lower Paris target is simply out of the question.
We can however observe the impacts already developing and know that even though the current situation is the coolest and calmest it will be for a very long time, it does provide a benchmark for a 1.5ºC world if future generations have the ability and resources to return the Earth to it.
2.0ºC
During the CERES era, the mean global surface air temperature has risen from +0.78ºC to +1.45ºC. In the same time, the EEA has totalled 321ZJ. If everything stays the same in terms of the rate of increasing EEI and the temperature response to it, a total of just 263ZJ is the additional energy accumulation required to reach +2ºC. At the current rate of EEI growth, this energy will be accumulated by 2033. Even if EEI suddenly stops increasing and remains at today’s level of 1.4w/m2, the necessary energy will still be accumulated by 2035.
This is sooner than the current temperature trajectory which shows crossing +2ºC in 2038, implying that the energy accumulation is leading the warming, showing that the feedbacks are taking some additional time to respond, which is entirely sensible and expected.
3.0ºC
Following the same logic as 2º above, an additional energy accumulation of 646ZJ is required to increase the temperature to +3ºC. On the current trajectory this will be achieved by 2045 (or 2052 with a static EEI from now on).
The big banks have revealed that they know the world is heading towards +3ºC and are preparing for that eventuality, advising their clients, investors and trade association members accordingly9.
Is a Remaining Carbon Budget still relevant?
Every year a fresh estimate is calculated for the remaining carbon that can be emitted while keeping the planet below the Paris targets. The latest values from the Global Carbon Budget10, as of January 2025, for limiting global warming to 1.5°C, 1.7°C, and 2°C is estimated to allow for emissions of 235, 585, 1,110 billion tons of CO₂, respectively. With today’s emission levels, that’s roughly 6, 14, and 27 years remaining for these thresholds.
In those time periods however, and keeping to todays emissions as they claim, the EEA will have increased by 150, 390 and 885 ZJ respectively. There is just no way that these carbon budgets are comparable with reality. Based on the CERES data above, adding 885ZJ to the Earth’s system would lead to a surface warming of +3.3ºC by 2050, not +2ºC.
The simple truth is that there is no remaining safe carbon emissions budget. Every tonne of future emissions will need to be mechanically removed to stay within the upper Paris Target.
Why is the remaining carbon budget so wrong? Potentially the answer lies in the low level of climate sensitivity preferred by the IPCC. The budget assumes a climate sensitivity of 3ºC for a doubling of CO₂ whereas recent studies based on observations and paleoclimate suggest a value of 4.5ºC11. Underestimating the impact of aerosol reduction and the cloud feedback response to warming also contribute to the optimism12. It also assumes that the current level of warming is much lower than it actually is. By using a 20 or even 30 year historic average, they can kid themselves that the current rise is only +1.3ºC or less, ignoring the very well documented acceleration that is underway.

Add in the fact that most climate models have missing feedback elements and have a track record of being conservative, even to the point of not including hotter results, and the illusion can be maintained.
We should be concentrating on a Remaining Energy Accumulation Budget
Instead of allowing policy makers to think there is a remaining safe amount of carbon that can be emitted, we should focus on the EEI and EEA. These provide the complete picture of where we are heading and how fast. Some of the numbers are hard to understand. w/m2 and zettajoules are not common topics at the coffee shop, but they could be presented in an easy to understand way.
It also allows for the deeper breakdown of the components so that the influence of emissions, feedbacks and actions can be clearly seen. Since the data comes from actual observations, it also inspires more trust than models often do.
It may even help with conversations around the relative merits and potential contributions of solar radiation management to increase albedo, decarbonisation and carbon removals to lower the GHG forcing, re-wilding to reverse the decline in natural carbon sinks, and so on.
These interventions are all hard and difficult measures to contemplate, but so are the implications of inaction. A +3ºC world is a terrifying prospect which will cause mass mortality events, incredible migration pressures, droughts leading to starvation and collapse of supply chains, insurance losses that will render large areas of the western world uninsurable leading to a credit crisis and economic collapse. On top of which many of the identified tipping points will be triggered such as die back of the rainforests, loss of all coral reefs, ice sheet collapse and rapid sea level rise.
Imagining that there is a remaining carbon budget to keep us safe is pure folly.
NASA CERES Mission - https://ceres.larc.nasa.gov
Are there any climate change indicators that aren’t accelerating?

Obviously temperatures are rising, but are they accelerating? Acceleration is an increase in the rate of change, not just the change itself. To show acceleration, two easy methods are available. Firstly you can see if a trend is linear (going in a certain direction but at a steady rate of change), or a polynomial where as the trend progresses, the gradi…
IPCC Sixth Assessment Report Working Group 1: The Physical Science Basis - https://www.ipcc.ch/report/ar6/wg1/
Christopher J Merchant et al 2025 Environ. Res. Lett. 20 024037 - https://doi.org/10.1088/1748-9326/adaa8a
European State of the Climate Report 2024 - https://climate.copernicus.eu/esotc/2024
James E Hansen et al, Global warming in the pipeline, Oxford Open Climate Change, Volume 3, Issue 1, 2023, kgad008, https://doi.org/10.1093/oxfclm/kgad008
George Tselioudis et al, Oceanic cloud trends during the satellite era and their radiative signatures, https://www.researchsquare.com/article/rs-3974146/v1
Natural CO2 sequestration peaked in 2008 and is now declining

In a paper published recently by the Royal Meteorological Society by James and Samuel Curran, they update analysis they carried out back in 2016 using the CO2 concentration data to 2024. They find that natural sequestration of CO2 peaked in 2008 and is now in accelerating decline.
Big banks predict catastrophic warming, with profit potential By Corbin Hiar - https://www.eenews.net/articles/big-banks-predict-catastrophic-warming-with-profit-potential/
Global Carbon Budget - https://globalcarbonbudget.org/key-targets/
Climate Sensitivity - The most important single number determining our future.

CO2 as the main control knob of climate
James E. Hansen et al (2025) Global Warming Has Accelerated: Are the United Nations and the Public Well-Informed?, Environment: Science and Policy for Sustainable Development, 67:1, 6-44, https://www.columbia.edu/~jeh1/mailings/2025/Hansen_etal2025.Envir_Global.Warming.Acceleration_FULL.abs.main.SM.pdf
I agree you cannot use long term trend analysis in a situation with increasing inputs from both man made biosphere changes and feed back loops. One wonders to the decrease in tropical cloud and tropical deforestation.
Water dancers for Ocean Thermal Energy Conversion (OTEC), the reason why OTEC energy projects were deemed too costly was the need for the suction tube to be made so rigid but working in the opposite direction would free up this variable.