
Climate change is accelerating!
There has been some debate as to whether global warming is accelerating or if the last few years are part of a natural blip on top of a linear trend. I take a look at the data and it's implications.

Obviously temperatures are rising, but are they accelerating? Acceleration is an increase in the rate of change, not just the change itself. To show acceleration, two easy methods are available. Firstly you can see if a trend is linear (going in a certain direction but at a steady rate of change), or a polynomial where as the trend progresses, the gradient gets steeper (increasing rate of change - acceleration). A polynomial is not to be confused with an exponential increase which is one that trends to infinite growth. Fortunately we are not dealing with any exponentials here. Warming will not continue forever. Eventually an equilibrium will be reached for whatever state we leave the system in. A net-zero if you like, either through deliberate policy or something very bad happening.

The second method is to look at the trend line for the rate of change. If this is a flat line, the rate of change is constant, then there is no acceleration, if there is an upward trend, then by definition there is acceleration in the system. (obviously a negative trend would signify deceleration but unfortunately we’re not likely to see any of these for a while).
Surface Air Temperature (SAT)
Let’s start with the main headline measure included in the Paris Agreement, air temperature. The long term SAT data from ERA5 is best fitted with a polynomial, this could be seen as proof enough that there is an acceleration, but that includes the steady temperature period in the 1940s to 1970s when aerosol pollution was masking the warming effect of growing carbon emissions, so we’ll just look at the data from the 1980s onwards. The polynomial is still the best fit, so test 1 points towards acceleration.

Taking it to test 2, we can plot the monthly decadal temperature change. This is the difference in surface temperature for the same month ten years earlier. So Jan 1992 minus Jan 1982, Feb 1992 minus Feb 1982 and so on to December 2024. Fitting a linear trend line to this plot shows an increase in the rate of decadal warming since 1992, starting at 0.87ºC/decade and accelerating to 0.31ºC/decade by 2024. 2023 and 2024 show as high rates of change, but 2013 and 2014 were below the trend line which would increase the recent apparent rate. Despite the noise, the linear line is suggestive of steady acceleration.
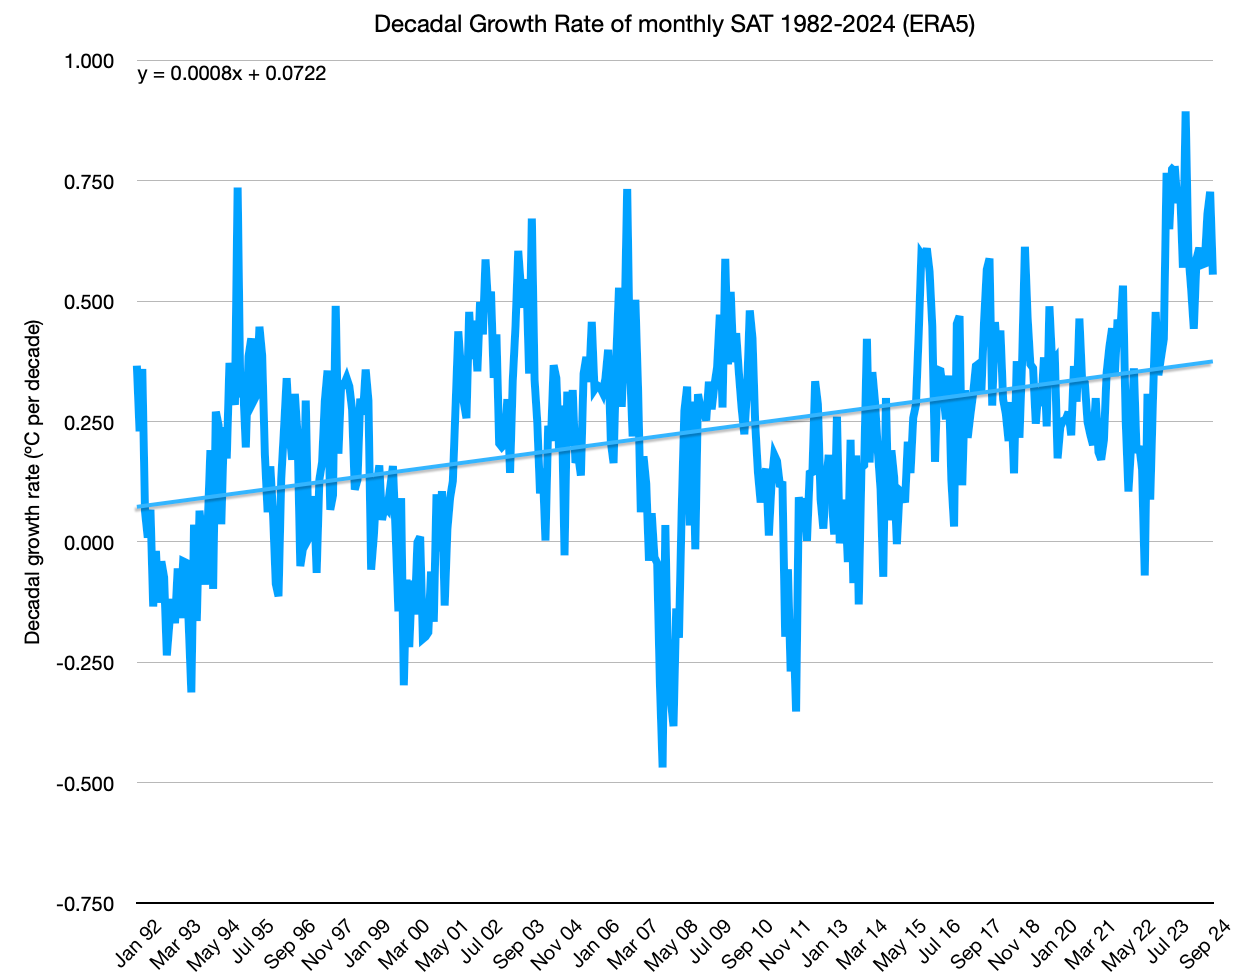
Meeting both tests, Surface air temperature is therefore accelerating.
Sea Surface Temperature (SST)
According to the IPCC AR6 analysis, the oceans absorb 91% of the additional heat being trapped in the climate system, so what of the ocean temperatures. We can look at this in a couple of ways. Sea Surface Temperature (SST) has also made the headlines recently and is relevant to climate impacts since it provides energy for tropical storms and evaporation potential for extreme rainfall events.

Plotting the mean annual SST again sees a polynomial as the better trend fit. Plotting the monthly decadal temperature change in the same way as for SAT, a clear upward trend is visible. SST was rising at a rate of 0.06ºC/decade in 1992 and has accelerated to 0.33ºC/decade by 2024.

Sea Surface Temperature is also accelerating.
Ocean Heat Content (OHC)
The oceans don’t just heat at the surface, mixing of the depth layers occurs through ocean currents, upwelling and overturning and wind action. Huge amounts of heat energy can therefore be stored in the oceans at different depths. We can look at the OHC in three layers and we see the usual familiar curved trend in every case. The shallower waters are accumulating heat fastest, but even below 2,000m deep, significant heat is accumulating.
The units of heat content are not measured in ºC but rather Zeta-Joules (10e22 Joules). A zeta-joule is a lot of energy, 1 ZJ is equivalent to 160 billion Hiroshima bombs worth of heat.
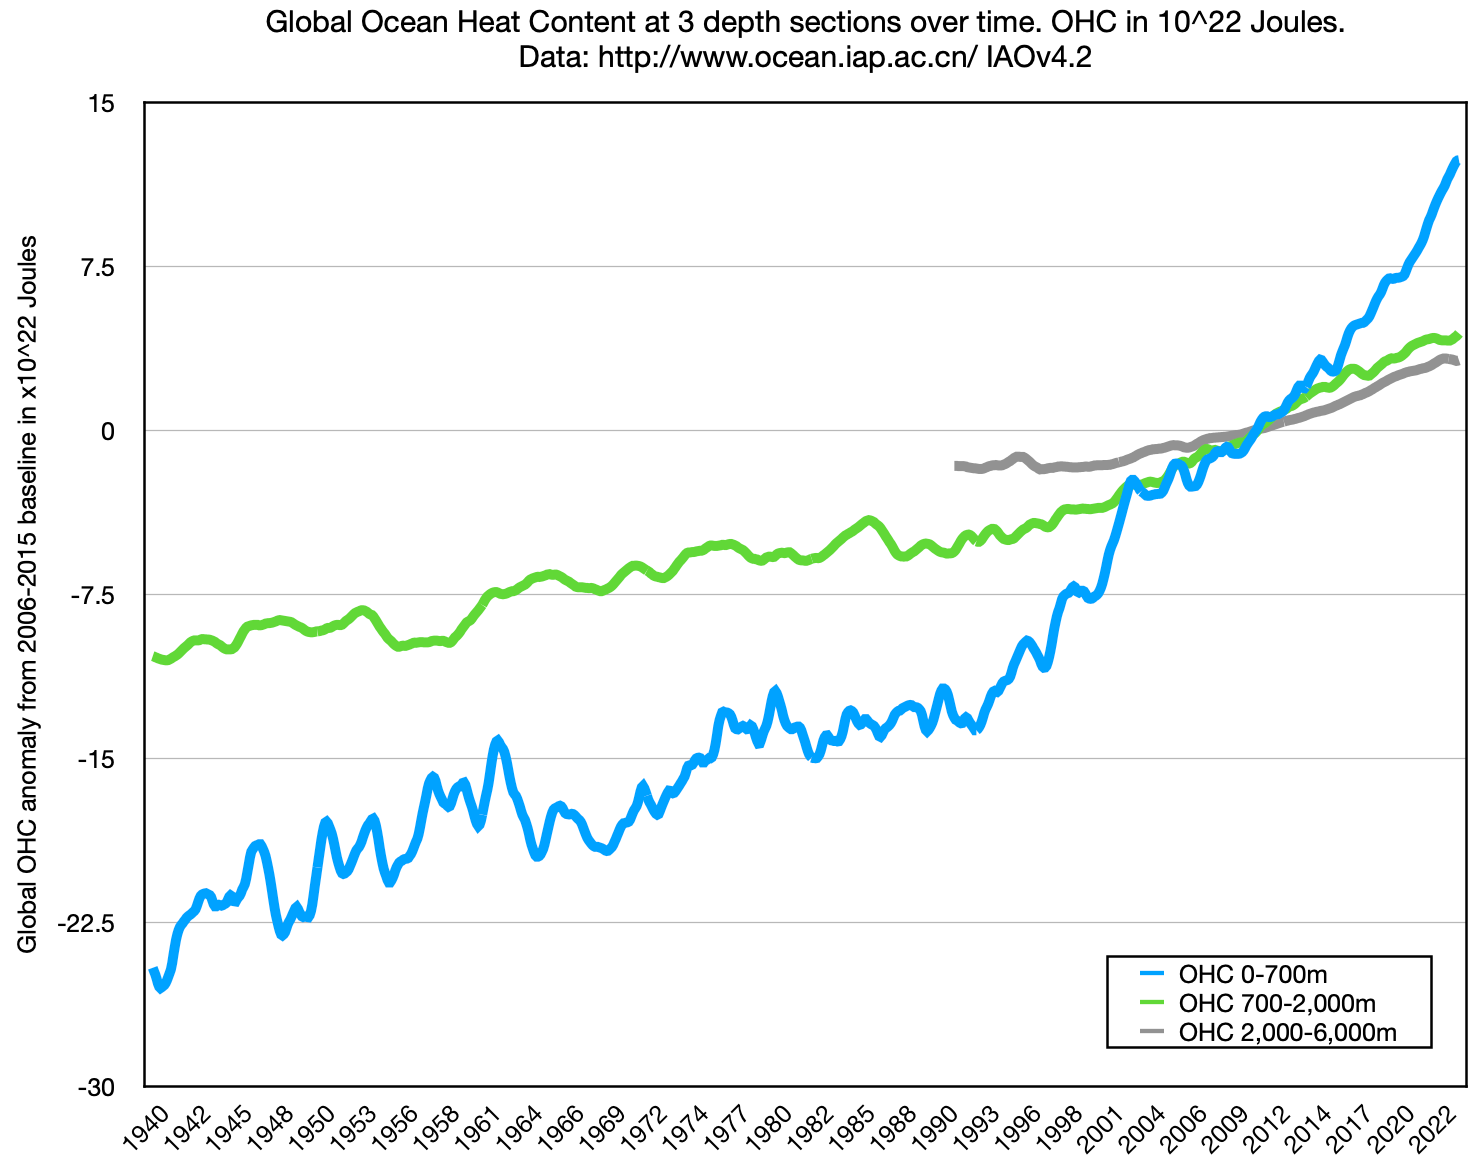
The values are based on the 2006 to 2015 mean baseline. The first observation is that at all three depths, the OCH lines cross above the mean baseline during 2011. More than half way through the 10 year baseline period which shows that acceleration is in progress since the energy content growth is higher in the second half of the period. A steady change would have crossed at exactly the half way point.
Looking at each depth separately and looking at the decadal rate of change (the lime coloured plots), once again we see the rate is increasing with time at each depth


Ocean heat content is accelerating at all depths.
Responses and Impacts
So the warming is accelerating in all domains, are the responses also accelerating?
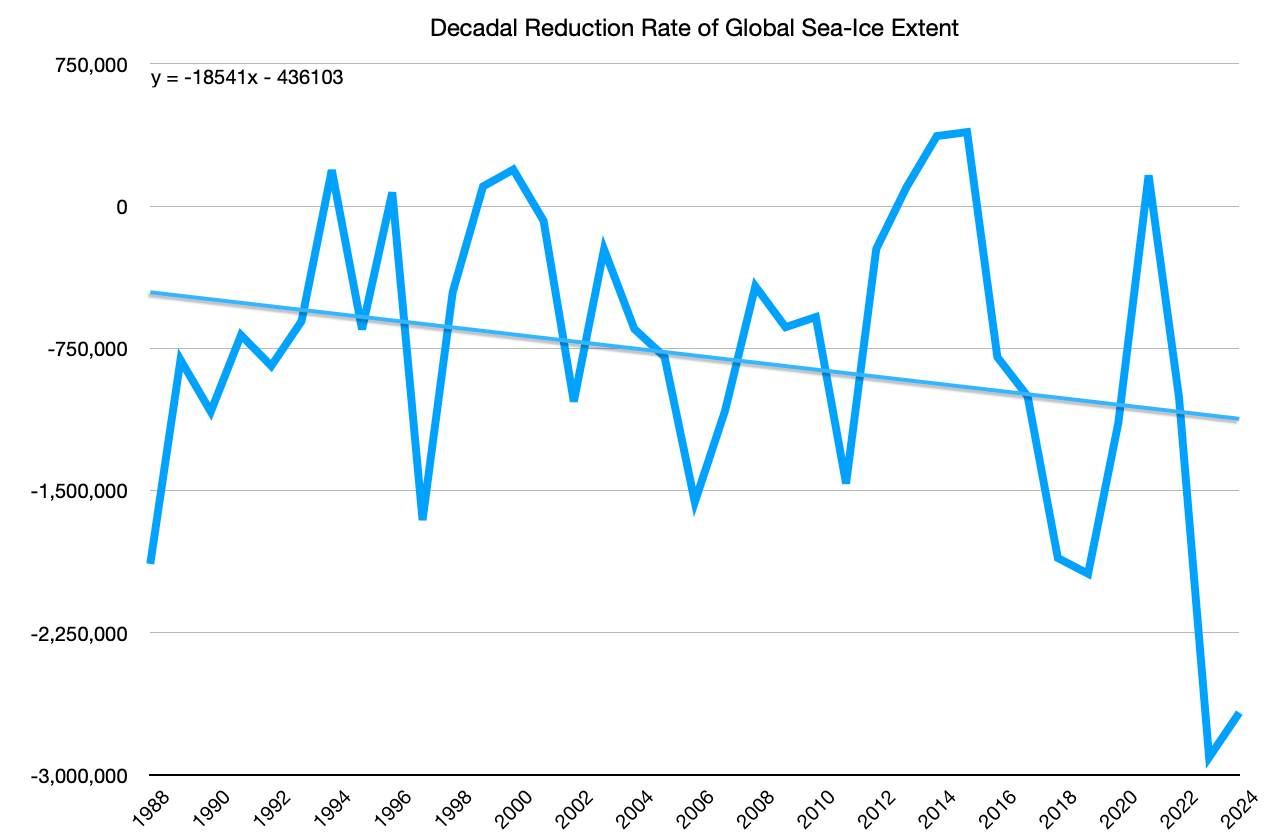
Making the news recently as another record low is reported, global sea-ice is declining as temperatures rise. Matching the acceleration of air and water temperatures, the extent of the sea-ice loss is also accelerating.

The linear loss rate trend shows 436,000 square kilometres per decade in 1988, rising to a loss rate of 1,104,000 square kilometres per decade by 2024.
Glacial ice is also declining quickly. In a new study1 combining global glacier data from multiple sources and methods, 5.4% of global glacial volume has been lost since 2000. The loss curve has the familiar curved acceleration shape.

Glacial ice melt is one of two factors driving sea level rise along with thermal expansion due to the warming water. The global mean sea level rise plot from satellite data shows the accelerating trend. Once again if we plot the decadal rate of increase, the familiar rise is evident signalling acceleration of this climate change response. The rate of rise has almost doubled in the last 20 years from 22.5mm/decade in 2003 to 43mm/decade by 2023.


Impacts on human infrastructure and safety are also accelerating. If we look at the graph of US billion dollar disaster events since 1980, the familiar curve is evident. The rest of the world is faring worse if anything.

Earth Energy Imbalance (EEI)
It’s actually no surprise that all the above indicators are accelerating as global warming is, at the end of the day, a result of the steadily increasing energy imbalance between the solar radiation entering the system and the reflected and re-radiated energy leaving the system. A positive EEI causes warming, a negative EEI causes cooling, an EEI of zero leads to a steady climate state.
The greenhouse gasses in the atmosphere trap the heat by restricting radiated long wave radiation from the surface and warming feedback effects such as reduced ice, snow and cloud cover, reduce shortwave reflection.
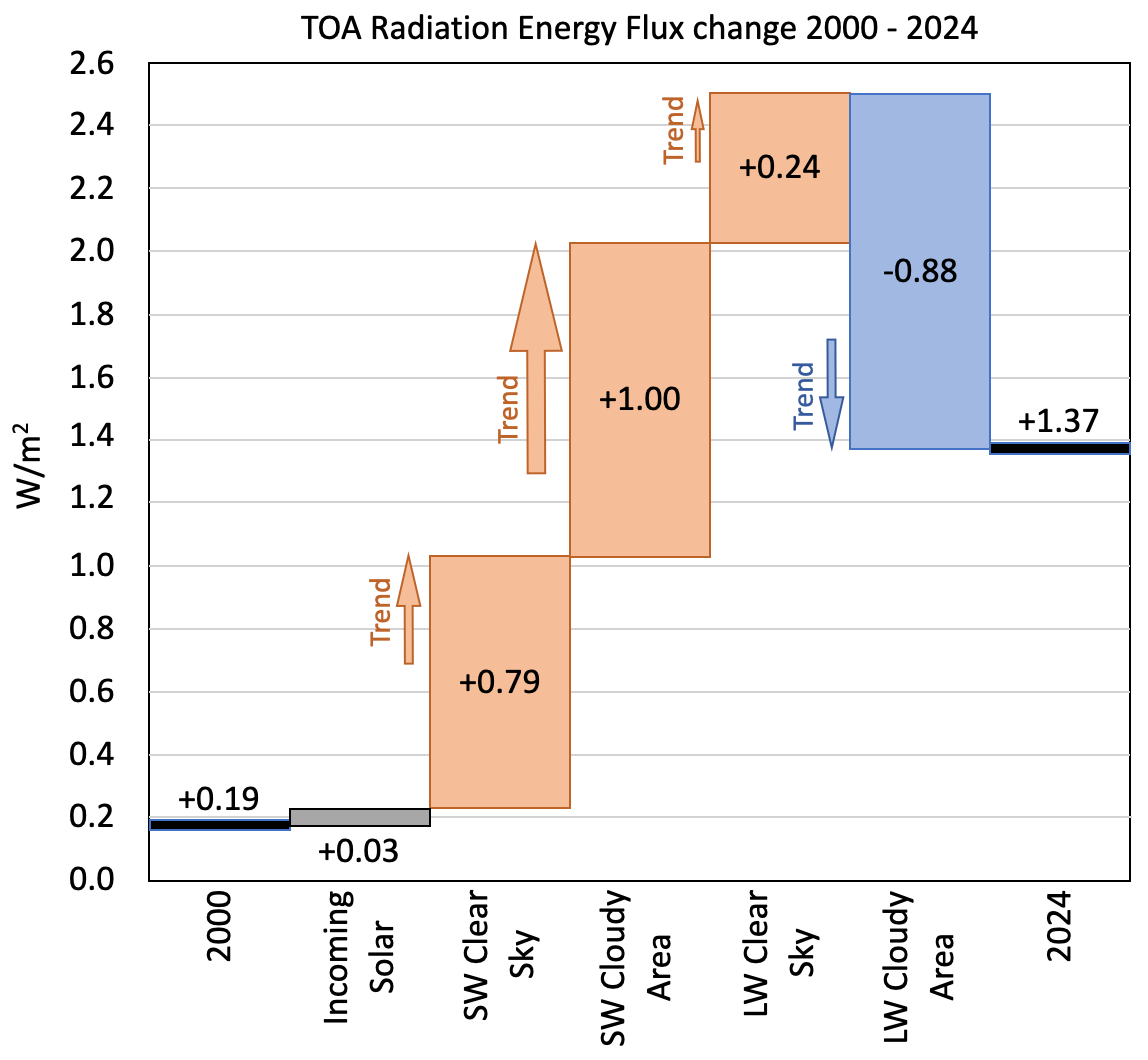
The growth of EEI since 2000 as measured by the NASA CERES mission has been linear, but the amount of energy involved is huge. In 2000, the EEI was 0.2w/m2. So for every square meter of earth’s surface, 0.19w was being absorbed. That may not sound like much, but the Earth has a lot of square meters (510,000,000,000,000), so this added up to the equivalent of 3 Hiroshima bombs worth of heat being absorbed every second! By 2024, the EEI has increased to 1.4w/m2 or 12 Hiroshima bombs per second!

EEI is the tap that sets the rate of warming, as it increases the flow rate of retained energy, the rate of warming in all cases accelerates with it. All the time that the EEI remains positive, warming will continue. All the time it is increasing, warming will accelerate.
The principle driver of this growth is CO2 concentrations, which, you’ve guess it, continue to accelerate together with the other greenhouse gases such as methane and nitrous oxide, which are also increasing year on year. The famous Keeling Curve of atmospheric CO2 concentrations is a continuous record since 1958. The saw tooth pattern is driven by the annual plant sequestration seasonal pulse in the northern hemisphere. The curve has the familiar polynomial shape and the annual increase rate is a steep gradient confirming acceleration.


There is some good news though.
While all the indicators are showing acceleration, so far none of them are showing a third order increase, or jerk. In other words, there does not appear to be an increase in the rate of acceleration itself. All the decadal growth plots fit a linear trend. This would imply that no recent step change has occurred, so no overarching tipping point has been crossed (yet).
This is very good news as it suggests that the situation is still recoverable on human relevant timescales with the appropriate level of effort.
The effort required will need to be hugely substantial, the only way to stop the acceleration, level off, slowdown and reverse the warming is to reduce the EEI, even taking it negative for a time. The only ways to do that are to reduce the atmospheric greenhouse gases and increase the earth’s albedo. Every year that passes when this does not happen strengthens the forces driving the warming and further accelerates the rate and severity of the impacts they bring. It also increases the risk of crossing a tipping point. There are many waiting in the wings ready to provide reinforcing feedbacks that can further accelerate greenhouse gas emissions and climate impacts.
Since the albedo loss is largely through feedbacks, aspects such as sea ice, snow cover and cloud fraction should increase if temperatures can be lowered. Looking in depth at the components of the EEI2 show that albedo drop is the main driver of its current increase, actually contributing more than the GHG component. A reminder that the Earth’s climate sensitivity, the amount of warming for a given increase in CO2, is a combination of direct greenhouse gas forcing plus feedback forcings.
So what of the Paris Agreement targets?
Given that the EEI continues to increase and that every measure of global warming is accelerating, it should be obvious to everyone that the +1.5º target cannot be achieved under current (or any practical) policies. The first 20 year period when average SAT exceeds that target will probably be 2016-2035, centring therefore on 2025. At the current trajectory, the first 20 year period exceeding +2ºC is likely to be 2029-2048, centring on 2038. Just 13 years currently separate the two targets.

All the IPCC scenarios that show any hope of staying below +2ºC rely on massive deployment of CO2 removal technologies and a huge shift in climate policy which does not seem likely before then end of this decade. No scenarios yet include any albedo management aspects, but these may well be discussed within the next round of IPCC reports (hopefully to be published by 2028). Geoengineering is becoming more and more likely as a means of capping warming while CO2 removal is scaled. It is not a solution in the medium or long term however. At best it is a temporary band-aid which comes with its own risks and drawbacks.
The overall conclusion is that global warming is indeed accelerating using all metrix and the reasons are well understood. Stabilising at +1.5ºC is no longer available, +2ºC is very unlikely, but there is still time to avoid +3ºC, but the window is closing fast.
Community estimate of global glacier mass changes from 2000 to 2023, The GlaMBIE team 2025, https://doi.org/10.1038/s41586-024-08545-z
A breakdown of the trends within the Earth Energy Imbalance (EEI) https://substack.com/home/post/p-157611237