


Climate Sensitivity - The most important single number determining our future.
How much warming is in the pipeline now CO2 has increased by 50%? Climate Sensitivity should provide the answer, but the uncertainty is huge. The future implications are significant.

CO2 as the main control knob of climate
When greenhouse gases are added to the atmosphere, the temperature goes up. This is well understood and evident both in the past and today’s world. How much it goes up for a given amount of greenhouse gas is described as Climate Sensitivity. This is defined as the increase in temperature for a doubling of atmospheric carbon dioxide. So given the pre-industrial atmosphere was 280ppm CO2, if we were to take it to 560ppm through fossil fuel burning, we could easily calculate the resulting temperature rise. If we say climate sensitivity is 3ºC, then a world of 560ppm would stabilise out at 3ºC above pre-industrial.
It’s important to understand that this applies to any doubling, so if future generations further raised levels to 1,120ppm, that would be a doubling from 560, so a total rise of 6ºC from pre-industrial, not a quadrupling from 280ppm (+12ºC). This logarithmic relationship is what prevents so called runaway climate warming, or cooling for that matter. It’s why a past climate of 2,000ppm didn’t result in Earth becoming Venus.
A recent paper by Emily Judd et al1 provides the relationship between CO2 and global surface temperature for the last 485 million years. The fit is remarkable and puts beyond question CO2’s role as the main driver of earth’s climate. Evidence that CO2 is the cause, and temperature the effect, comes from volcanic outgassing events that result in temperature increase, not the other way around.

Equilibrium Climate Sensitivity and Earth System Sensitivity
There are two common ways of defining climate sensitivity. The most common and the one used in climate models is Equilibrium Climate Sensitivity (ECS). ECS is the eventual global temperature change caused by doubled CO2 if ice sheets, vegetation and long-lived GHGs are fixed (except the specified CO2 doubling). Effects and feedbacks affecting Earth’s energy balance such as clouds, aerosols, water vapour, snow cover and sea ice change rapidly in response to warming and are included. ECS is called the ‘fast-feedback’ climate sensitivity for this reason.
Earth System Sensitivity (ESS) is the second definition and includes all the slow feedbacks held fixed in ECS such as ice sheet growth and decay. ESS is useful on longer timescales such as looking back at Earth’s past epochs where the resolution of the measurements is much courser.
The two are useful since ECS tells us what to expect on short timescales of decades, while ESS tells us where the planet is heading as a whole.
You might think that we would have a good handle on what this vital number should be by now, at least to a couple of decimal places, but the latest Intergovernmental Panel on Climate Change (IPCC) report, AR6, published in 2021 suggests a probable range from 2 to 5ºC. This is a huge range. We have already increased CO2 to 425ppm which is 50% higher than the pre-industrial level. This range of ECS points towards a committed temperature rise of between +1ºC to +2.5ºC, which are radically different futures.
The complexity of the problem
What makes ECS so problematic is partly due to the definition (what’s included and no included) and partly due to the sheer complexity of the earth system as a whole.
The amazing complexity of the Earth system reminds me of a joke -
A farmer has a contract to deliver 1,000 eggs per week to a local market, he wants to know how many chickens he needs to keep in order to reliably fulfil the order. Fortunately he has a physicist friend who offers to create a computational Farm System Model based on formulae derived from past records and observations of the chickens’ behaviour. A while later he comes back with the answer of 857.9 chickens. However he warns the farmer that his model only works for spherical chickens in a vacuum.
The list of variables in earth’s climate system (let alone a chicken farm), are absolutely huge, and many of them are not even known yet, let alone understood or adequately modelled. For example, clouds are a large uncertainty. Low level clouds reflect sunlight back into space, cooling the planet, but high level clouds trap heat in the atmosphere and warm the planet. As temperatures rise the balance between these two is uncertain, would there be more of one type than the other? What effect would changes in wind patterns have on cloud formation, what effect would rising temperatures have on evaporation and condensation, if aerosol pollution was reduced, what effect would that have and how quickly and where on the planet…
The IPCC AR5 report in 2014 had the range of cloud forcing from a net slight cooling to high warming. By AR6 in 2021 the range had reduced to between very slight warming to strong warming, still a very wide range of uncertainty. This advance did little to limit the range of probable ECS.
Looking to the past
To try and address these uncertainties, scientists have turned to paleoclimate observations. By looking at past CO2 levels and coincident temperatures, estimates of both ECS and ESS can be made.
One approach is to look at the last glacial maximum, 20,000 years ago. CO2 levels were about 180ppm. Temperatures were between 6 and 8º lower than the stable Holocene or pre-industrial level, does that provide an answer? Well, yes but again with large uncertainly. The CO2 levels are well known from ice core analysis. Tiny bubbles of ancient air are trapped in the ice that can be accurately measured. The temperatures on the other hand are determined with proxy readings of marine creatures in sediments, chemical isotopes, detection of pollen from plants with known preferred climates and so on. Remember also that we are trying to get at a temperature equivalent to the average global surface air temperature. How much of a temperature gradient existed between the tropics and the poles? What effect did the large ice sheets that covered north America and northern Europe have?
Despite these issues, good estimates of ECS and ESS have been made based on this time period. A 2023 paper by James Hansen et al2 landed on an ECS of 4.8ºC and an ESS of 10ºC. Remember that the ECS definition keeps ice sheets the same though, so calculation is again difficult, since by definition the difference between a glacial maximum and an interglacial is the amount of ice.
The Judd paper mentioned earlier uses a range of proxies to reconstruct CO2 and temperature over the last 485 million years. It uses a slightly different measure termed Apparent Earth System Sensitivity (AESS) but is compatible with ESS as defined above. They landed on an average value of 7.7ºC for a doubling of CO2. AESS includes both fast (e.g., clouds and sea ice) and slow (e.g., ice sheet growth and decay) climate feedbacks. However, it also implicitly assumes that the impact of changes in solar luminosity, paleogeography, non-CO2 greenhouse gases, or other forcings compensate for each other in someway.

Another approach is to explore what the climate was like the last time CO2 was over 400ppm. This was actually 3 million years ago during the Pliocene epoch. A study by Jessica Tierney et al3 used geological evidence of sea surface temperature at the time, coupled with climate models to create a representation of the Pliocene climate, including surface air temperatures. They found that global temperatures were 4.8ºC warmer than pre-industrial in the early Pliocene and 4.1ºC warmer in the middle of the epoch. In addition to observations about ocean temperature gradients and monsoon patterns, the study resolved an ECS of 4.8ºC, matching Hansen et al, at the high end of the IPCC range.

Why Climate Sensitivity matters
You may be asking why this matters so much. The basic answer is that ECS and ESS define where we are going in terms of climate and how quickly. Due to the inertia of the system, a higher ECS increases response time. The warming effects of reducing shipping fuel aerosol pollution in 2020 is still growing today, 5 years later.
Robust ECS allows policy makers to judge remaining carbon budgets and set time limits for reaching net-zero. It also profiles the risks of tipping points, likely sea level rise, likely changes in weather extremes and basically every other input into planning for the next few decades.
Prof Johan Rockstrom from PIK recently stated that if ECS is above 3ºC there is no remaining emissions budget to stand a 50% chance of staying under +1.5ºC. Given the current acceleration of all the climate indicators and that the trend line shows us clearly on at least +1.45ºC now, that’s a fair bet. 1.5º is dead.
So, if ECS is indeed above 3ºC, what does that do to the IPCC forecasts under their various emission scenarios?
A recent PIK study by Christine Kaufhold et al4 ran three common IPCC pathways with a range of ECSs. They chose SSP1-2.6, SSP4-3.4 and SSP2-4.5 which are ‘normally’ associated with +1.5º, +2º and +3ºC temperature rises. The 3ºC SSP2-4.5 is suggested to be closest to historic emissions to date.
With an ECS of 5ºC, the top end of the IPCC range but close to the findings above, the three pathways deliver maximum global mean temperature anomalies of +3.4ºC, +4.6ºC and +7.2ºC, roughly twice the maximum warming produced with an ECS of 3ºC. Therefore, there is a non-negligible probability that, despite the impossibly ambitious decarbonisation rate required under SSP1-2.6, Earth could still undergo ∼3.5ºC of warming.
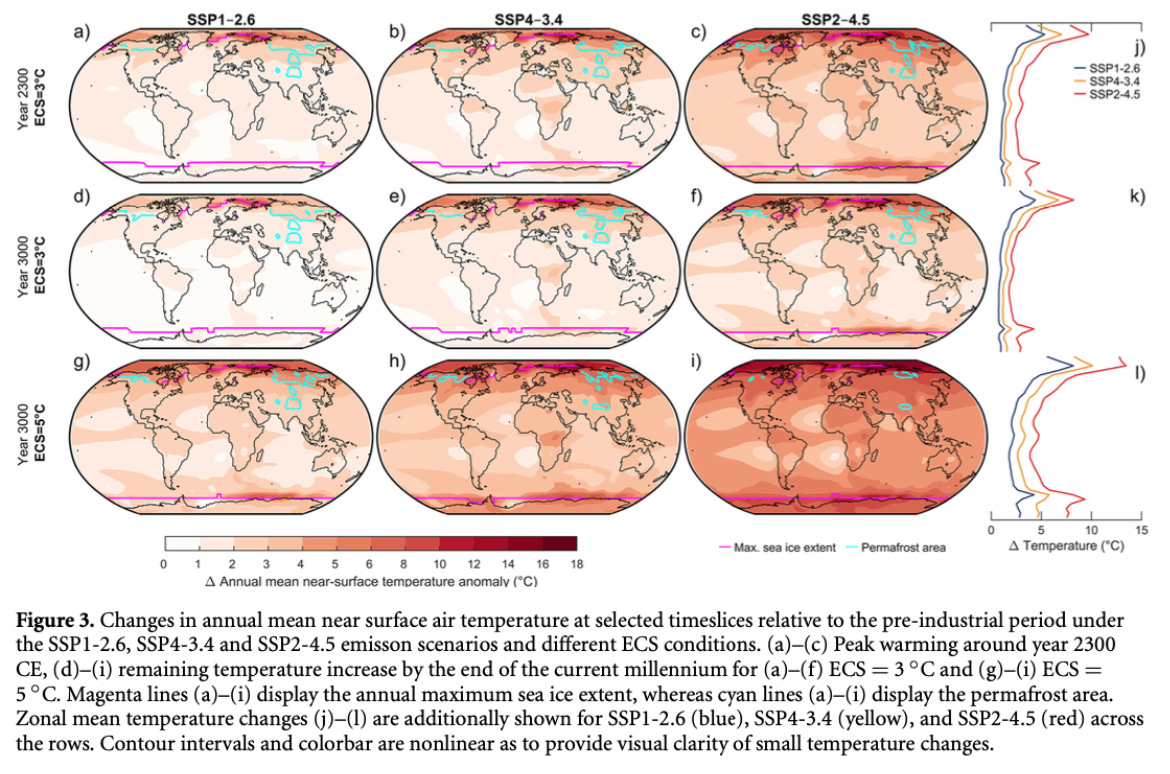
Even if all emissions stopped overnight, a settled rise of ~3ºC cannot be ruled out. In fact the analysis shows that even achieving the Paris Agreement’s aim of limiting global warming to well below 2°C is only feasible under very low emission scenarios, AND if climate sensitivity is lower than current best estimates.
The large differences are due to carbon cycle feedbacks since this study not only included methane but also modelled permafrost melt, wetland emissions and plant and soil carbon storage impacts, both positive and negative.
If that wasn’t bad enough, the study did not include plant CO2 saturation, nitrogen availability, extreme weather damage to carbon sink ecosystems, methane life extension, reduced ocean biomass sequestration through ocean acidification, ice sheet changes to ocean circulation or any triggered tipping points. Any of which would further increase temperatures.
Predicting the future
Without wanting to complicate matters further, there is one more consideration when thinking about the near future and climate sensitivity. Remember that ECS deals with fast feedbacks while ESS includes slow feedbacks. In reality there is a range of response times and there will be overlaps between the two definitions, even over decades.
The amount of water vapour that can be carried in air is defined by the Clausius-Clapeyron equation and states that if the temperature of the air is raised by 1ºC it can carry 7% more water. This is an extremely rapid feedback. Dew is formed overnight when the temperature drops. The atmosphere is not going to wait for a 20 year average to go up 1º before allowing its additional 7%. Recent acceleration of flooding events show this to be the case.
Aerosol emission reduction, especially shipping reductions regulated for in 2020 is being felt through reduced solar reflection, allowing the Earth to accumulate more energy. When it comes to radiative warming like this, about 40% of the eventual (equilibrium) warming will be achieved by 2030, 60% by 2120, and 90 percent in about 1,000 years. The early response is largest over continents, where the response is not held down tightly by the ocean’s great thermal inertia. The same is also true for greenhouse gas emissions. The temperature increase lags the emissions, leading to significant ‘warming in the pipeline.’ 5

Methane is a short lived gas in the atmosphere, typically it lasts 10-12 years before converting to CO2 and H2O through reactions in the atmosphere. In that time however it is much more potent as a greenhouse gas. 80x over 20 years. Methane levels are twice what they were in pre-industrial times and have accounted for 30% of the warming over the last 40 years. Traditional ECS does not include this factor, despite it being well understood to act as an accelerator in deglaciations.
Sea ice is included in ECS as a fast feedback. As temperatures go up, sea ice extent and volume reduce, thus reflecting less sunlight, leading to further increased warming, and so on. But lower sea ice volume effects ice sheet melt rate and ocean circulation, which are not included.
Arctic sea ice volume is diminishing at a rate of 250 km3/year. This is effectively a freshwater injection into the Arctic sea water, lowering the salinity of the ocean as a whole. This is equivalent to the total freshwater melt coming from Greenland. Freshwater injection is a major problem for the stability of the AMOC. These effects are not included in standard ECS or many of the IPCC models.
Planning for the future
This all sounds very disheartening, but it’s better to have the reality, even if it’s difficult. If we recognise that the likely future warming will be faster than we think, with greater impacts, then we can try to reinvigorate efforts to decarbonise and to invest heavily in adaptation and resilience planning before it’s too late.
Recognising this encroaching reality, Stephanie Rost’s paper6 ‘How we could survive in a post‐collapse world’ is a good starting point for policy makers thinking beyond the next election cycle.
When the IPCC estimate that current policy direction leads to +2.7ºC warming by the end of the century, they are assuming an ECS of 3ºC. If the most recent studies are correct, as backed up by all the accelerating signals around us, and that ECS is actually ~4.5ºC, then current policy is taking us to at least +4ºC. This is the reality we need to be planning for.
https://doi.org/10.1126/science.adk3705
https://doi.org/10.1093/oxfclm/kgad008
https://doi.org/10.1029/2024AV001356
https://doi.org/10.1088/1748-9326/adb6be
https://doi.org/10.1093/oxfclm/kgad008
https://doi.org/10.1007/s44282-025-00160-1
add to this further deforestation and ground water depletion, I have been throwing around the idea
The imperative is to understand the true time associated with evolution and come to the understanding that this is in conflict with our economic system, In all context we are out of time and therefore should not associate the time value of money with evolutionary time, once we free ourselves of this we will be able to create the money as a separate ledger for the ecological necessities and fully employ the huge underutilized resource of human capital in many parts of the world for this essential endeavor. Nature is not our slave and gives us trillions of dollars of benefits every year, Governments need a separate ledger to account for this so we can print this money to look after it.
One thing I noticed a few decades ago working in NZ was the undercutting at the base of the steep estuarial land boundaries with very little ocean rise and increased wave action , One could only imagine what will happen when whole mountain sides are undercut and the slopes start sliding into the ocean. Stability in some contexts is standing on a razors edge