


Sea Level Rise - How much, When and Why it Matters
4.5mm a year doesn’t sound like much, but that’s far from the full story. Regional variations, water sources, gravity, currents, rebound and surges combine to make it a serious accelerating threat.


Sea levels are rising. They have been doing so for over a century, but the rate of rise is now accelerating rapidly. Since satellite measurements began in 1993, the rate of rise has doubled1. The current rate is now a little over 4.5mm per year. The two graphs below show the rise in sea level on the left using both historic and satellite measurements. The right hand graph shows the steady increase in the rate of rise during the satellite era.

Causes of Sea Level Rise
Sea level rise is due to two global warming related drivers. About 30% of the increase is due to thermal expansion of the ocean water itself. 91% of the additional heat accumulating in the climate system, through our carbon emissions from fossil fuel burning and land use change, accumulates in the oceans. Ocean heat content data shows this warming accelerating at all depths, causing the water to expand. This is known as steric sea level change. This will continue until we stop accumulating greenhouse gases in the atmosphere and the whole climate system settles into a new equilibrium. Due to the thermal inertia however, this will take a long time, meaning a lot of ocean warming and therefore, sea level rise is baked in and cannot be reversed on any meaningful human time scale.

The majority of the rise is however due to barystatic changes which is the redistribution of water between the land and the ocean. The principle components of this are the melting of glaciers and ice sheets as the climate warms.
Glacial melt
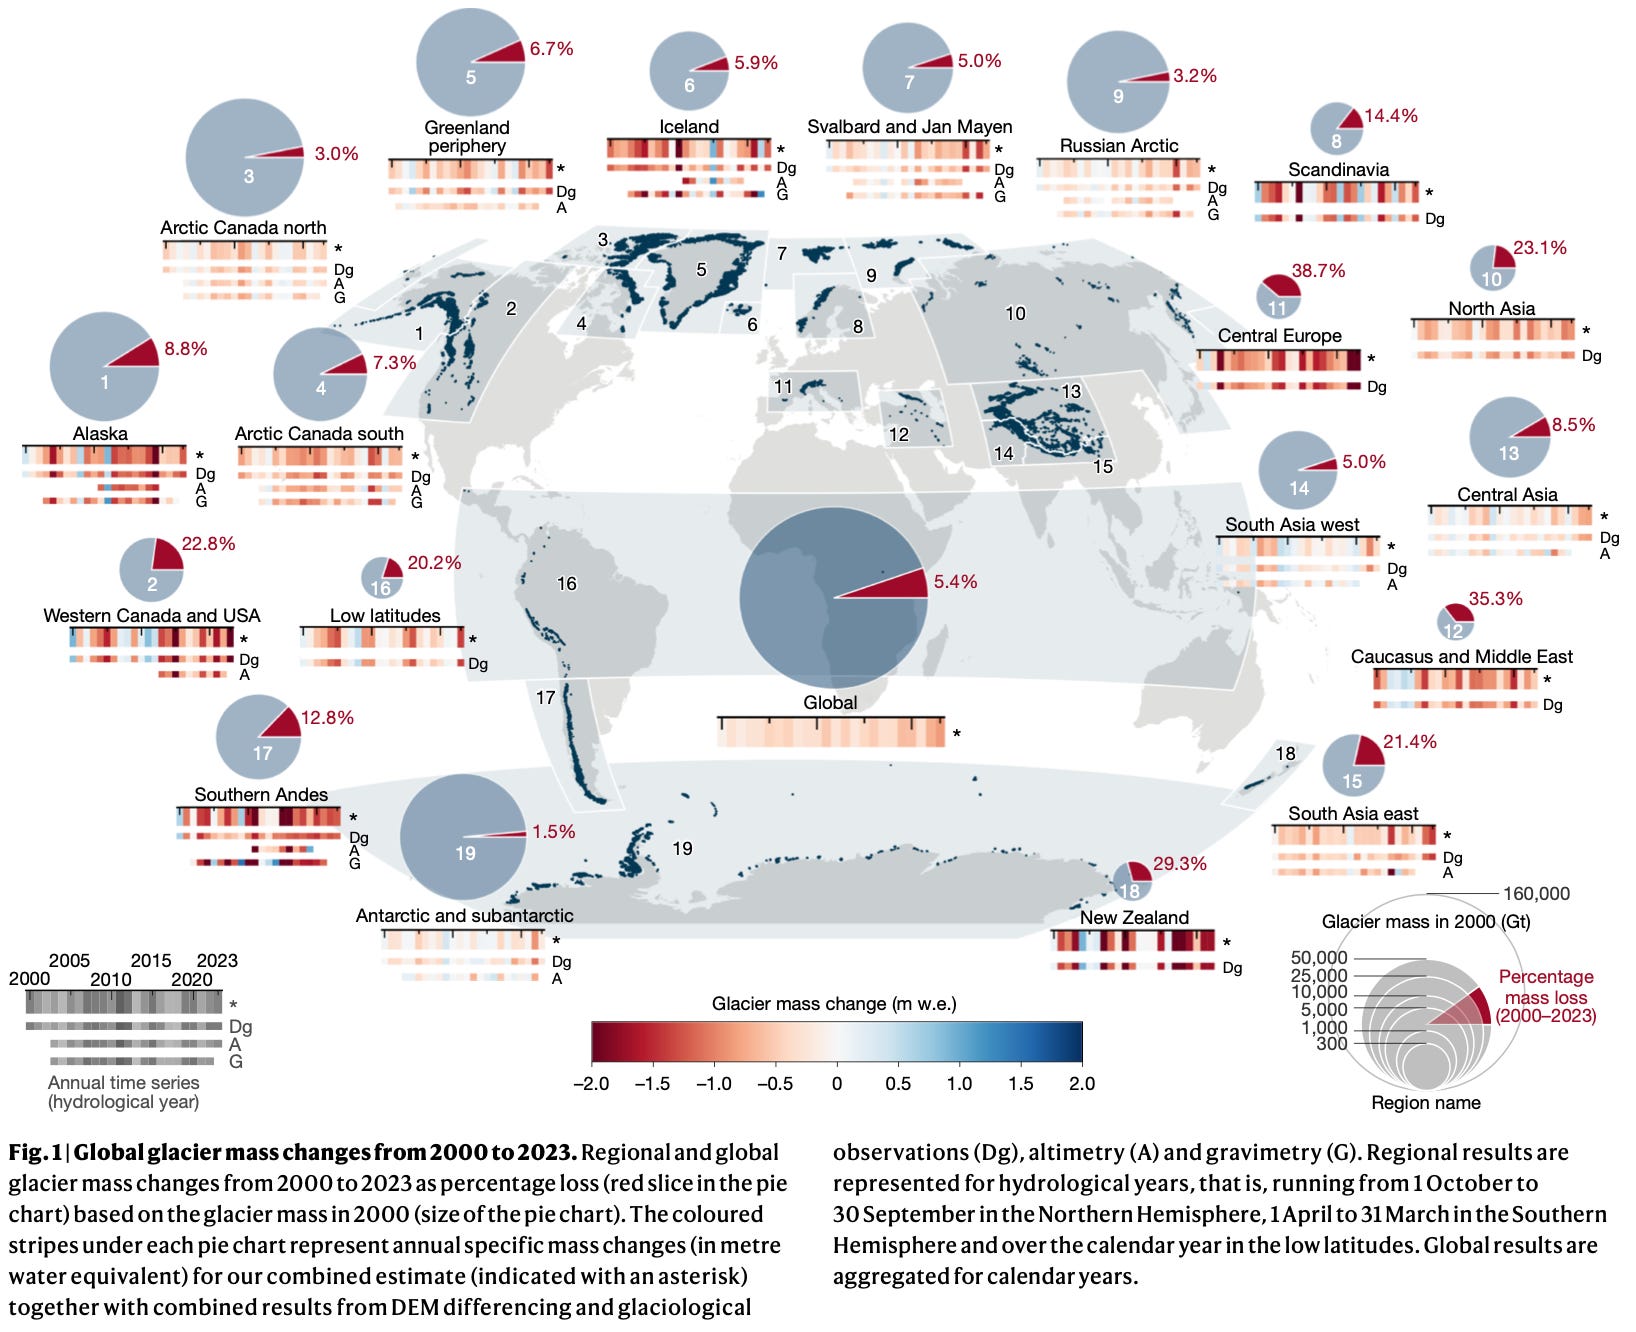
Glaciers are melting around the globe with European glaciers melting the fastest. Since 2000 global reduction in glacial ice volume is more than 6,500 km3. A major community study published last year mapped the global distribution of glacial mass changes from 2000 to 20232. The study found that globally glaciers had lost 5.4% of their mass in just the last 23 years. European glaciers had lost a staggering 38.7% with many other regions in the 20-30% bracket including western Canada and the US, New Zealand, north Asia and the Caucuses. Not a single region saw an increase in glacial volume.
Ice sheet melt
The two major ice sheets of the world hold the most fresh water. These are the Antarctic and Greenland ice sheets. The Antarctic ice sheet is actually two sheets separated by a completely buried mountain range. The West Antarctic Ice Sheet (WAIS) is melting rather quickly while the East Antarctic Ice Sheet (EAIS) is more stable, even accumulating some ice over recent years due to increased snowfall. The Copernicus graphs below show the relative contributions over recent decades3. Despite the larger EAIS stability, the continental total loss is still significant.

As a quick aside, the little kink in the blue Antarctica curve at 2023 has been suggested to prove that climate change is a hoax by some climate deniers - talk about cherry picking your data!
If both ice sheets melt completely, sea levels would rise by 66m or 215 feet, but this would take many millennia and is not currently likely. In the last few decades however, ice sheets have overtaken mountain glaciers are the main source of barystatic sea level rise.
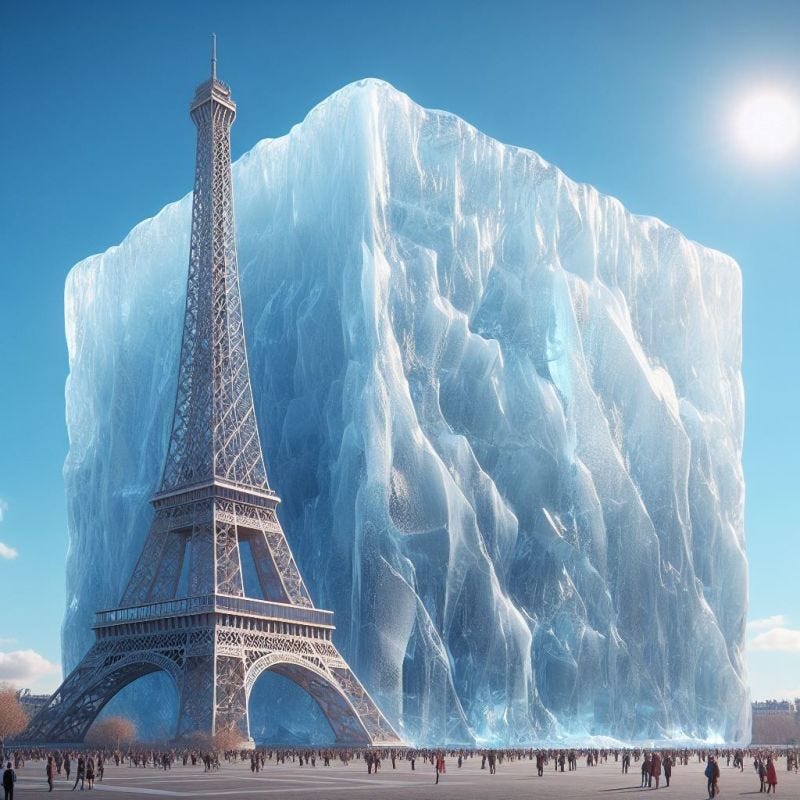
All these big numbers and units in gigatons are hard to comprehend. To put it into context, this image by ETH Zurich Master Graduate Enrico Van der Loo, shows the ice loss from Greenland every hour! That’s 30 million tonnes of melt water per hour. All the fresh water from these melting glaciers and ice sheets pours into the world’s oceans raising the sea level, but not uniformly.
Regional variations
Sea level rise is not uniform around the globe. Various factors mean some regions are rising at higher rates than others. Some areas are actually falling as the plot below shows. Red areas have rising and blue areas falling. Some regions, which unfortunately encompass small island states like Tuvalu in the Pacific, are rising as fast as 10mm per year.

There are a lot of factors which cause these variations.
Gravity
Just as the moon’s gravity draws ocean water towards it, generating tidal rise and fall, the two ice sheets contain enough mass to gravitationally draw water towards them. As Greenland’s ice melts and it loses mass, it loses gravitational pull and actually results in a drop in sea level around its own coastline. The same is true with Antarctica, note the blue tint against the WAIS coast as opposed to the EAIS coast due to the relative melting of the two ice sheets.
This phenomena creates a fingerprint of global sea level changes depending on the contribution of water from each ice sheet. This is used by paleo-climatologists to decipher changes observed in earlier interglacial periods. According to a new study examining fossil coral reefs in the Indian Ocean4, in the last interglacial (the Eemian 125,000 years ago) melting and refreezing of the two ice sheets were out of phase with each other, creating periods of rapid rise and fall in sea level changing the height of the reefs in the geologic record. The highest reefs reflected a sea level 5.5-9m higher than today, but the asynchronous ice sheet contributions masked the full extent of retreat for each individual ice sheet, implying greater temperature sensitivity of ice sheets than previously thought. Today, both ice sheets are melting at the same time since the melting is driven by global warming rather than the Earth’s orbital cycles. Future rises could therefore be greater and faster than those seen in previous interglacials.
Isostatic Changes
Earths crust also rises and sinks depending on the mass on top of it. As an ice sheet grows, the land it is growing on presses down and sinks slowly into the mantle. The reverse happens when the ice melts. The image below shows the changes still underway from the end of the last ice age 11,700 years ago5. This is known as isostatic rebound.

Relative sea level in Scandinavia is not changing as fast as eastern Canada due to the land rising and falling in the two regions. Scotland is still rising, but acting as a lever, this is pushing southern England down, meaning sea level rise is more noticeable in the south and east of England than in Scotland.
Subsidence
Related to isostatic changes but more local and much more rapid. It has been noted that some large cities are sinking faster than the surrounding countryside due to the weight of imported building materials and the removal of groundwater. This causes subsidence as the city presses down and deforms the bed rock beneath. On a tiny scale this was observed with the construction of the Hinkley Point C nuclear power station in the UK. On a project visit to the older Hinkley Point B station while the foundations of the new plant were being pumped out and constructed, the engineer told me that the B turbines had needed some alignment shims installed due to the C site works 1km away, which had resulted in some movement of the turbine floor. We are only talking about a few millimetres, but it illustrates the point that rock is a material that can be deformed and changes in mass at one location, affect the shape of the surrounding land.
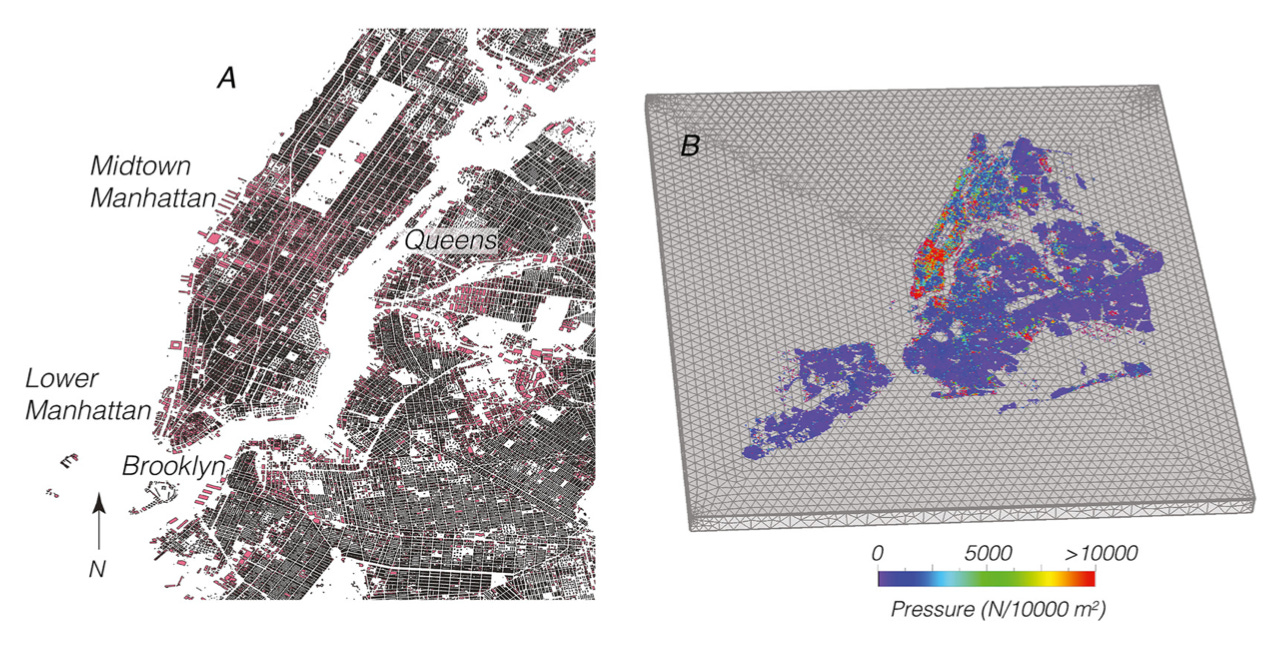
A 2023 study of New York showed that the city was sinking by 1.7mm per year on average as a result of the weight of all the skyscrapers6. This is on top of the isostatic regional changes and the rising sea levels. The relative sea level rise on the coastline is therefore being amplified.
The situation in New Orleans is even worse. A new satellite study has detected localised sinking in the city, the airport, the surrounding wetlands and even the new (post Katrina) concrete dykes. The rate of sinking is up to 28mm per year7.
Ocean Currents
The great ocean conveyor belt of currents also influences sea level as it moves bodies of water around the planet. Of most concern in terms of sea level rise is the Atlantic Meridional Overturning Circulation or AMOC. This is the current that draws warm water from the tropics into the north Atlantic before cooling and falling to the deep to return to the Southern Ocean. The huge flow of water to the south is sufficient to reduce local sea level in the north Atlantic. One of the main concerns for the region is the projected slowing and potential collapse of the AMOC through the melting of Greenland ice which releases fresh water into the ocean, hindering the density changes that drive the current.
A recent study by Liping Zhang et al.8 correlated 50 years of tidal gauge measurements on the US northeast coast to AMOC strength. The study shows that during times of weaker AMOC strength, the tidal gauges measured up to 70mm of additional height, and up to 90mm lower than normal during peak AMOC flows.

An AMOC collapse would add 1m of sea level rise to the US northeast coast, Scandinavia and to a lesser extent northern Europe. This would be in addition to the baseline changes through thermal expansion and ice melt. Whilst a full collapse is thought less likely this century, though an area of intense research, the IPCC has good confidence in significant weakening.
Taken together, the rise in thermal expansion, melting of ice sheets and glaciers, the sinking of the city and AMOC weakening, the title picture of Time Square above, could be called High Tide in Manhattan. It’s an AI image now, but what could happen in the future?
Future Sea Level Rise
The million dollar question is what can we expect in the future. How fast will the waters rise, where and to what extent? Let’s take a look at one analysis from Climate Central9 then dive into the projections for the various drivers. The map below shows the areas of land expected to be below the tideline in a +2.7ºC world - the projected (though likely optimistic) global mean temperature increase by 2100. This level of land loss would be extremely serious, the costs of protecting the red areas would be incredibly high, probably unaffordable. This analysis is based on the 2021 IPCC AR6 report.

I do have one more bombshell to drop though. The current set of sea level rise models used by the IPCC don’t take ice sheet dynamics models into account. They were too many unknowns for them to have sufficient confidence to include them in the last report, so there is currently no coupling between the ice sheet models and the ocean models in these projections. Instead, a simple trend is used for water volume contribution.
In the IPCC ARG WG1 report10 they show this by plotting low confidence dashed lines against the different scenarios. The takeaway message being it will be at least as bad as the solid lines and probably/possible as bad as the dashed and dotted lines. Half a meter by 2050 and over 2m within 75 years is the worst case suggested with a 1 in 20 chance.

But let’s take a closer look at where this water would come from and how stable it is in its current form.
Drivers of future sea level rise
Steric rise
In terms of the steric rise, that caused by the ocean’s own thermal expansion, that will be determined by the emissions pathway we follow and the Earths climate sensitivity. Currently the Earth’s energy imbalance is rising at double the rate predicted. This is probably due mainly to a high feedback response from cloud area and brightness reductions and aerosol pollution reductions, but is being urgently researched11. Current geopolitical trends are also pointing towards an SSP3-7.0 future rather than an SSP2-4.5 one which would guarantee temperatures exceeding 3ºC. It’s safe to assume that steric rise will continue to be a major factor.
Glaciers
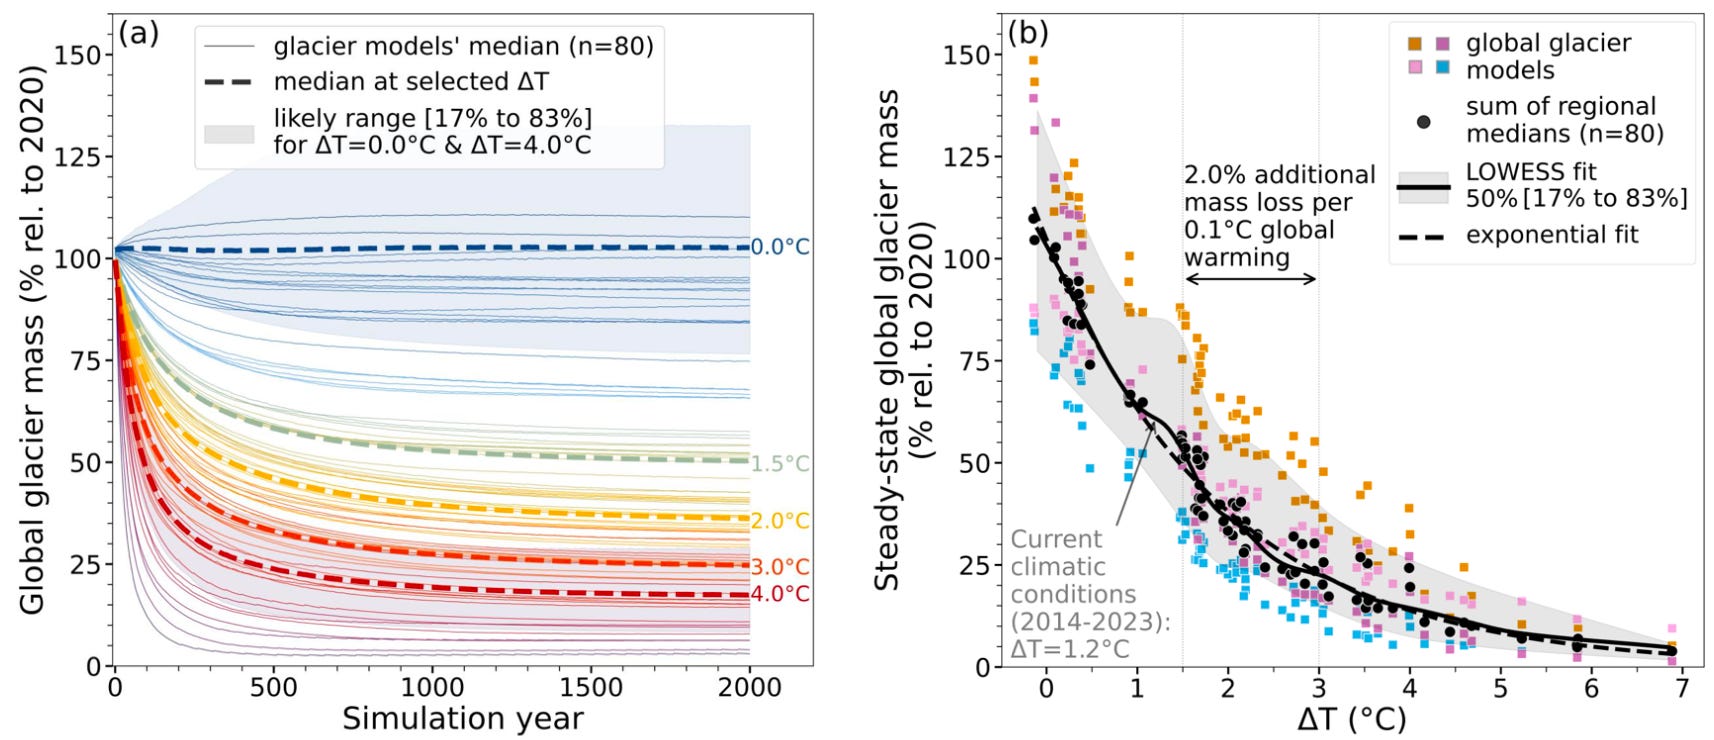
A new study12 has analysed the expected glacial losses from global warming reaching different levels. Even if warming stabilised at today’s level, the world would still lose 40% of its glaciers. It’s clear that they sit at a perilous point where only slight warming has a big impact on melt rates. The study found that if warming is limited to 1.5°C, at least 54 per cent could be preserved—more than twice as much ice as in a 2.7°C scenario which would see a loss of 76% of total volume.
The loss takes a long time, but it is clear from the left hand chart below that the short term rate is very much temperature dependent. The right hand chart shows the relationship between temperature above pre-industrial and eventual glacier loss. For every 0.1ºC of warming, we lose an extra 2% of the glacial volume.
Glacial loss can be very rapid, more so than ice sheet loss. Another recent study13 showed that Canada and the conterminous US lost 12% of its glacial volume just between 2020 and 2024. Switzerland lost 13% in the same time period. That’s almost 100 billion tonnes of ice in just 4 years.
The next chart matches the one earlier but shows the regional losses for different levels of warming. The difference between 1.5º and 2º is huge and reinforces the message that staying at 1.5º is not a nice to have, it’s a requirement for global climate stability. Don’t forget that 2 billion people rely on glaciers for they water supply.

Ice Sheets
Both the world’s ice sheets are subject to tipping points. When it comes to Greenland, the mechanism is based on the altitude of the ice cap. As it melts, the height drops, lowering it into warmer air. This speeds up the melting which lowers it further. A tipping point is reached when this effect is self perpetuating with no additional average global warming. According to the latest research by Jakob Deutloff et al.14 the threshold best estimate is +1.5ºC. Once triggered, melting will accelerate continuously, even if temperatures are stabilised. Carbon dated plant matter from the base of ice cores confirm that the Greenland ice sheet collapsed during at least one interglacial in the last 400,000 years when temperatures were close to today’s15.
The Antarctic ice sheet, especially the WAIS, is of greatest concern. Studies into the previous interglacials show that the ice sheet has collapsed multiple times in the past. One study was able to prove this by mapping octopus DNA16, finding that the creatures must have been able to distribute themselves across the continent during at least the last two interglacials. This can only be possible through a collapsed ice sheet with either open water or sea-ice covered sea way, rather than a freshwater grounded ice cap.

A significant recent study17 into the tipping behaviour of the WAIS confirmed that it is liable to collapse at or within +0.25ºC of today’s temperature. Based on previous occasions over the last 800,000 years, 4m of sea level rise can be expected once the event is triggered, although the pace of the collapse is not well constrained as yet. The Saychelles fossil reef study mentioned earlier suggests that the rate could be at the high end of projections based on their dated sea level changes from the same period.
The big uncertainties in the collapse of the WAIS include a phenomena called ice cliff instability. This is where during retreat the exposed ice cliff is so high that it fractures forward under its own weight. There is no observational evidence of this happening as yet so it remains a theoretical possibility. As such it is not included in the IPCC ice sheet models. Models that do include the phenomena show much faster melt rates.
Looking at the different drivers of sea level rise and the latest data and research into their mechanisms adds significant weight to the argument that the rate of rise will continue to accelerate and reach the high end of estimates put forward in the last IPCC report. Countries should therefore be preparing for at least a 1m rise within 75 years, which will continue thereafter at at least 10-20mm per year on average and well over 30-40mm per year in some regions. A precautionary principle would suggest we should be preparing for 1.5m.
Why Sea Level Rise Matters
The actual rise is bad enough for many low lying coastal cities and communities, but there are two additional factors which make it even more concerning. Saline intrusion and storm surges.
Saline intrusion
As sea levels rise, salt water moves further inland affecting crop land and groundwater. A 20 year study of the Bengal delta in Bangladesh found that significant ground salination was experienced even 200km from the coastline in the low lying delta18. This has collapsed local agriculture and resulted in more than 10 million people having to abandon their property and move to slums outside the major cities. They are climate refugees through no fault of their own. Similar problems are likely in other low lying land masses and deltas such as the Nile in Egypt, Lincolnshire in the UK, Flanders in Belgium and Holland and southern Florida, to name a few.
Storm Surge
Tropical and extratropical storms increase local sea level considerably, partly through low air pressure and partly through wind driven water mass. The 1953 north sea storm that flooded areas from Scotland to Holland and Belgium recorded a sea surge of 3.35m. Surges from tropical hurricanes make this look small though as the map from SurgeDat19 shows.

These surges sit on top of the base sea level, so a storm that generates a 3m storm surge today, has the effect of a 4m surge in the future. That extra meter of normal sea level means the damage travels farther inland, multiplying the loss and damage incurred. In some cases it will make the difference between sea walls holding, and sea walls failing, increasing the damage by orders of magnitude. Hurricane Katrina had a surge of 8.53m.
Hurricane Sandy which flooded New York in 2012 had a storm surge of 5.33m. Add in the accelerating base sea level rise, the isostatic sinking of the city and a slowing AMOC, and a repeat of that storm even in the next decade could be devastating.
Conclusions
Sea level rise is a creeping threat. 4.5mm per year may seem a small amount, but the causes and drivers are all likely to accelerate in a continually warming world. Only some of the drivers can be slowed through concerted climate action, meaning a lot of future rise is baked in and will have to be adapted for. This will inevitably include surrendering some land to the sea.
Meeting the Paris goal of +1.5ºC would mean 10cm less sea level rise than +2ºC by 2100. That’s not much but it would mean 10 million fewer people would be impacted. Even under a medium emission scenario, Europe is set to lose over 2,500km2 of land within 75 years. With our current policy trajectories however, +3ºC or higher by 2100 is more than likely.
This is an area that demands urgent action for those countries and communities with coastal borders, low lying cities and deltas. At the recent UN Ocean Conference in Nice, it was revealed that of the 22 EU nations that have coastal adaptation plans, only 6 of them included sea level rise. This is just bizarre given the time and investment it takes to build coastal defences. The London Thames barrier for example took 20 years to plan and 10 years to build at a total cost of £2.4 billion pounds (at today’s prices). The post Katrina works in New Orleans cost $15 billion and are losing protective effectiveness with every year that passes.
Urgent climate action to decarbonise the world economy can still have a positive effect though, saving lives and reducing loss and damage. Slowing thermal expansion, slowing glacial melt and avoiding ice sheet tipping points are still within our grasp (just).
Check out the projected impacts of sea level rise in your region using the Climate Central tool.
Hamlington, B.D., Bellas-Manley, A., Willis, J.K. et al. The rate of global sea level rise doubled during the past three decades. Commun Earth Environ 5, 601 (2024). https://doi.org/10.1038/s43247-024-01761-5
The GlaMBIE Team. Community estimate of global glacier mass changes from 2000 to 2023. Nature 639, 382–388 (2025). https://doi.org/10.1038/s41586-024-08545-z
EU Copernicus data and websites:
Karen Vyverberg et al, Episodic reef growth in the Last Interglacial driven by competing influence of polar ice sheets to sea level rise, Science Advances, 2025, Vol 11, Issue 24 DOI: 10.1126/sciadv.adu3701
JPL. -ftp://podaac.jpl.nasa.gov/allData/tellus/L3/pgr/browse/PGR_Paulson2007_Rate_of_Lithospheric_Uplift_due_to_PGR.png, Public Domain, https://commons.wikimedia.org/w/index.php?curid=17240066
Tom Parsons et al. The Weight of New York City: Possible Contributions to Subsidence From Anthropogenic Sources, 2023 https://doi.org/10.1029/2022EF003465
Simone Faischi et al., Vertical land motion in Greater New Orleans: Insights into underlying drivers and impact to flood protection infrastructure, Science Advances, 27 Jun 2025, Vol 11, Issue 2, https://www.science.org/doi/10.1126/sciadv.adt5046
Zhang et al., Skillful multiyear prediction of flood frequency along the US Northeast Coast using a high-resolution modeling system, Sci. Adv. 11, eads4419 (2025) 16 May 2025
IPCC Sixth Assessment Report Working Group 1: The Physical Science Basis, 2021 https://www.ipcc.ch/report/ar6/wg1/
https://theconversation.com/earth-is-trapping-much-more-heat-than-climate-models-forecast-and-the-rate-has-doubled-in-20-years-258822
Menounos, B., Huss, M., Marshall, S., Ednie, M., Florentine, C., & Hartl, L. (2025). Glaciers in Western Canada‐conterminous US and Switzerland experience unprecedented mass loss over the last four years (2021–2024). Geophysical Research Letters, 52, e2025GL115235. https://doi.org/10.1029/2025GL115235
Deutloff, J., Held, H., and Lenton, T. M.: High probability of triggering climate tipping points under current policies modestly amplified by Amazon dieback and permafrost thaw, Earth Syst. Dynam., 16, 565–583, https://doi.org/10.5194/esd-16-565-2025, 2025.
Paul R. Bierman et al. Plant, insect, and fungi fossils under the center of Greenland’s ice sheet are evidence of ice-free times, PNAS, 2024, 121 (33) e2407465121 https://doi.org/10.1073/pnas.2407465121
Sally C. Y. Lau et al. Genomic evidence for West Antarctic Ice Sheet collapse during the Last Interglacial, 2023, https://www.biorxiv.org/content/10.1101/2023.01.29.525778v2
Chandler, D.M., Langebroek, P.M., Reese, R. et al. Antarctic Ice Sheet tipping in the last 800,000 years warns of future ice loss. Commun Earth Environ 6, 420 (2025). https://doi.org/10.1038/s43247-025-02366-2
Sean E. Feist, Mohammad A. Hoque, Md. Atikul Islam, Ashraf Dewan, Mike Fowler, Sea-level rise drives changes in salinisation patterns in low-lying Bangladesh, Ecological Indicators, Volume 176, 2025, 113543, ISSN 1470-160X, https://doi.org/10.1016/j.ecolind.2025.113543
Storm surge database https://surge.climate.lsu.edu/data.html
I would have thought the increase in water vapor as a green house gas would increase the overall heat content and hence its impact on melting the glacial mass and ice sheets. As there is a reduction in precipitating nuclei as a result of land use changes then this mass will stay as vapor longer before condensation into cloud.
Another note I referred to before is the percentage of coastline which has built an equilibrium balance of slope to erosion of this slope as most shorelines are either rock overlain with clay or just clay of varying rigidity both of which are susceptible to undercutting and destabilizing the clay topsoil's of the whole slope. I saw the start of this undercutting in New Zealand and the turbidity effects on the fragile estuarial ecosystems. Such ecosystems when in balance can handle the turbidity in sporadic events but as sea levels rise this will not be storm related but happen on any windy day.
Thermocline mixing for hurricane dampening has been studied in places like the gulf of Mexico using old oil rigs I assume but may be more necessary if our current projections are too optimistic.
Thanks again for such a thorough post.
This is a must-read article for those of us concerned with climate change. Very much appreciate the work that went into it.
Will warmer air leading to increased oceanic evaporation, resulting in more water vapor permanently in the atmosphere to any degree offset cryosphere melting inputs? I haven't run into any discussions of that nature.
Great article!