How will we know when we’ve reached 1.5ºC of warming?
The definitions of global warming are varied and can cause confusion, but clarity is vital for legal and policy reasons. A new standard has recently been proposed.
Scientists from the University of Graz in Austria have addressed the issue of determining a realistic quantification of the current degree of warming and are calling for standardisation to assist policy and legal decisions as well as underpinning the next round of IPCC reports and 2028 Global Stocktake.1
The Problem
The problem of defining current warming and therefore developing Paris compliant policies is in part caused by the vagueness of the Paris Agreement text.
“…holding the increase in the global average temperature to well below 2°C above pre-industrial levels and pursuing efforts to limit the temperature increase to 1.5°C”
Firstly what does “well below 2°C” mean? Many treat it as simply 2°, but that’s not the aim. Is 1.9°good enough to satisfy the goal, or should it be lower? The Glasgow Climate Pact in 2021 resolves “to pursue efforts to limit the temperature increase to 1.5°C” so maybe “well below 2°C” should be closer to 1.5° than 2°. Some scenario work uses 1.7° as a sensible mid point.
What about the temperature itself. It’s become accepted that temperature increase refers to global average surface temperature compared to the baseline average between 1850 and 1900, which is thought of as pre-industrial. Before we can move on though, the IPCC has two definitions for surface temperature2. Global Mean Surface Temperature (GMST) and Global Surface Air Temperature (GSAT or SAT for short). GMST uses a combination of land surface air temperature at 2 meters above the ground and sea surface water temperature, since air temperature over the oceans is not readily available. GSAT overcomes this by using reanalysis (physics formulae) to determine air temperature over the oceans from sea surface measurements in order to provide a global average surface air temperature. This tends to be the one used most often as it links better to climate models and is more intuitive.
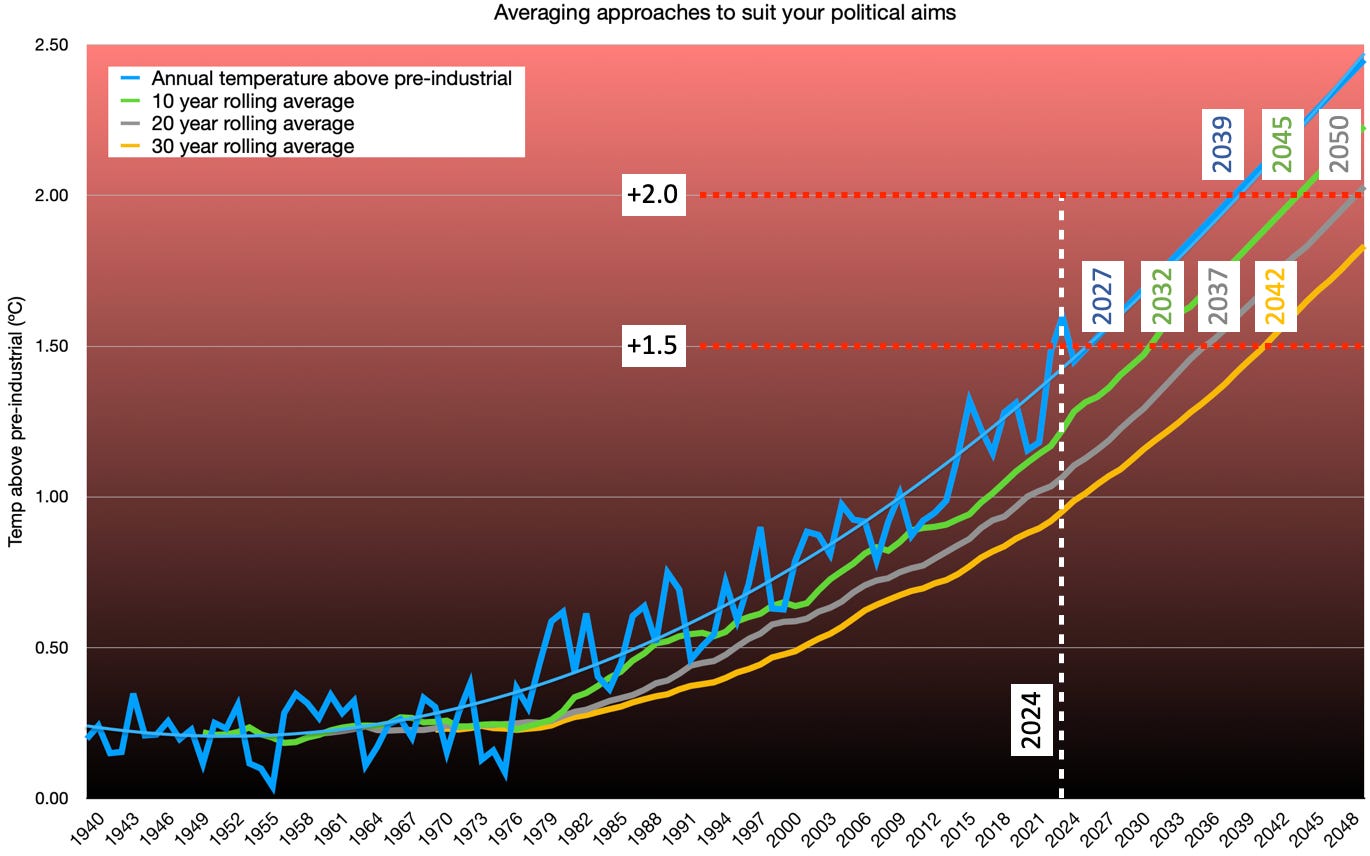
But what about the averaging? Elsewhere in the Paris text the average is defined as being on a decadal timescale, but does not specify the number of decades. The graph below shows what a difference this can make. It has become widely accepted that two decades is the norm, but many still use three. But where should the centre be? Is it purely historic or should it be centred on the date in question and include a forecast for future periods? A 20 year historic calculation is a poor estimate as it lags behind the acceleration that has been in effect for the last few decades. It shows warming of just 1.07°C by 2024. Indeed the 2023 Global Stocktake reported that temperatures had only risen by 1.1°C, while a simple polynomial trend shows 1.45°C (the blue line in the graphic). Notice that even the 10 year historic average decouples from reality after 2012 (green line).
The proposal of a centred average isn’t new. A Nature article back in 2023 made the case well and it seemed to have gained some support for a while.3 It seems obvious as a high school student would be failed for saying anything other than the blue line above was a suitable fit for the data.
Using poor techniques that yield results like current warming is 1.1°C are dangerous as they provide the public and policy makers with false confidence that there is time remaining to take action and that the situation is not yet urgent. Whereas the reality is much more pressing since exceeding 1.5°C is actually very close. After all, extreme weather events and tipping points occur in the actual climate, they don’t wait 20 years until an imaginary line is crossed before crying havoc.
As the paper’s authors state:
“It is therefore of fundamental importance to aim at a clear and shared science-based and benchmark-data-traceable understanding of when and how the Paris goals are reached or not. This aim was recently addressed specifically for the 1.5°C goal, proposing also next steps towards a metric and harmonisation activities in the IPCC context. We expect such a “standardisation”, jointly for the 1.5°C and well-below-2°C goals, to be highly useful across the science and policy domains, and to serve as a robust basis also for the legal domain concerned with legislation (e.g., climate lawmaking) and jurisdiction (e.g., climate litigation) to safeguard human rights, fairness and equity, in particular also for the young and future generations.”
The proposed solution
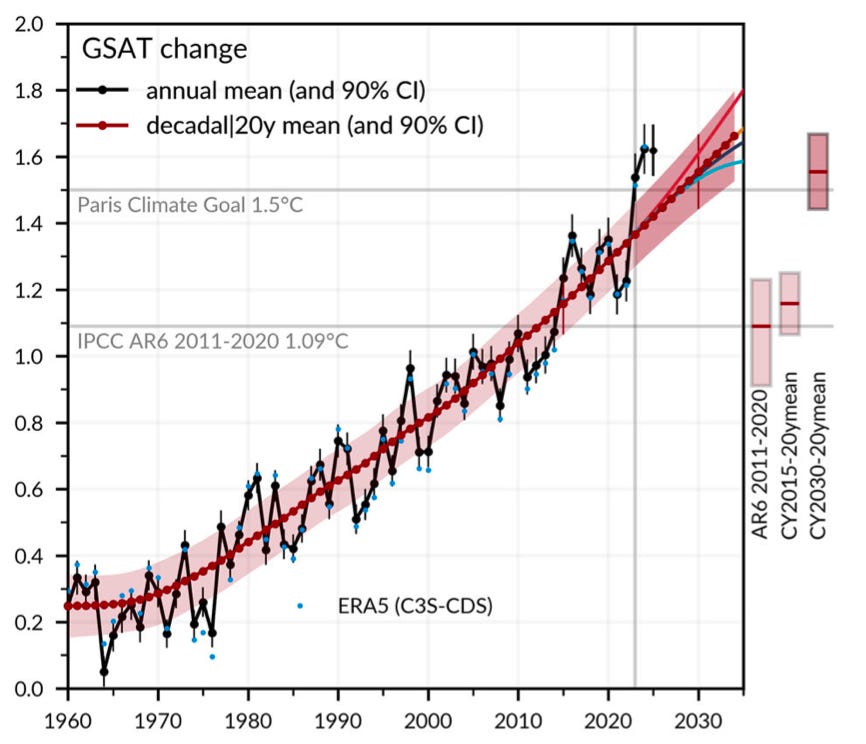
The new proposed method includes a new global surface temperature time-series from 1850-2023, a value for 2024 and projections to 2034. It further provides representative shared socio-economic pathways (SSP) scenarios to 2050.
The method is pretty technical but well described in the paper. It builds on the best science and IPCC work from the last assessment reporting round. I’ll let you explore it further if you’re interested, but as you can see it’s a much better fit for the data than any historic averaging approach.
Using the new approach shows that by 2024 the global average temperature had climbed to 1.39°C and is highly likely to cross the 1.5°C threshold by 2028. There is a range depending on the emission pathway but 2028 aligns with the currently best fitting SSP2-4.5 scenario. Following this scenario the 2°C threshold would be crossed by 2047 with 1.7°C crossed by 2036.
The make communication easier, the paper proposes four simple zones to represent the temperature. This should help the public and policy makers track goal compliance now and in the future.
The four zones are:
T1.5C - Paris compliance Target 1.5°C, equating to below 1.5°C
WB2C - Well below 2°C, the range from 1.5°C to 1.7°C
RB2C - Exceedance Risky below 2°C, the range between 1.7°C and 2°C so no longer “well below” and approaching 2°C
EX2C - Exceedance 2°C - above 2°C so missing the Paris goals completely
The names may need some work from a PR and Comms perspective, but the intent is good and it would provide clarity on the current position and near term trajectories.
Plotting the data for the different SSP scenarios to 2050 show how the different scenarios affect the future temperatures and the compliance with the Paris goals. They show a much worse case than the IPCC AR6 report but to my mind are far more realistic. The currently most likely SSP2-4.5 is heading beyond 3°C by the end of the century. It would be interesting to see the bad case SSP3-7.0 trend which fits between SSP2-4.5 and SSP5-8.5 since this is where current US federal policy is trying to head.
The approach also has the benefit of being updated yearly so that accelerations and decelerations not linked to El Niño or volcanos can be included straightaway.
Adoption
Getting a new methodology accepted and adopted will be a struggle though. To this end, the paper concludes with a roadmap for adopting a new standard.
Consolidation of the temperature records, complemented by predictions, projections and scenarios towards an IPCC-adoptable benchmark.
Consolidation of the Paris compliance/exceedance class definitions through science-policy dialogue to set a Paris Agreement monitoring standard.
An assessment and adoption process by the IPCC as part of the upcoming seventh assessment cycle, for use by interested parties worldwide including within the next Global Stocktake.
The next IPCC Global Stocktake will be produced in 2028 as part of COP 33. Using this method, (or any other centre based trajectory), they will almost certainly have to report that 1.5°C has been exceeded.
If they produce a result based on historic averages again, stating that temperatures have only risen by 1.2° or 1.3°C it will send completely the wrong message at a critical point for the future of the climate and provide excuses to limit ambition and delay adaptation efforts.
The dataset of historic values together with the projections of different SSP scenarios are available at the following link:
https://gcci.uni-graz.at/global/cwm/?var=Global-surface-temperature-change
Kirchengast, G., Pichler, M. A traceable global warming record and clarity for the 1.5 °C and well-below-2 °C goals. Commun Earth Environ 6, 402 (2025). https://doi.org/10.1038/s43247-025-02368-0
IPCC Sixth Assessment Report Working Group 1: The Physical Science Basis, 2021 https://www.ipcc.ch/report/ar6/wg1/
Richard a. Betts et al. Approaching 1.5 °C: how will we know we’ve reached this crucial warming mark? 2023 https://www.nature.com/articles/d41586-023-03775-z


Caution…. Climate Uncovered is not a scientific site.. its an activist site and will cancel comments that don’t fit the climate emergency narrative.