


A breakdown of the trends within the Earth Energy Imbalance (EEI)
In 2021 a paper was published using CERES data to examine the various energy flows that are causing global warming. Updating to 2024, the analysis forecasts continued accelerating warming.

In 2021 a paper called ‘Radiative Energy Flux Variation from 2001–2020’ was published by Dübal and Vahrenholt1 using NASA’s CERES data to examine the various energy flows that are causing the planet to warm. Adopting their approach to include data to 2024 shows the continuation and acceleration of most warming factors.

The CERES mission uses satellites to monitor the energy flows into and out of the earth, it also measures cloud fraction and temperatures across the planet, all at 1º resolution. The data is freely available2 (for now). Data has been continuously collected since March 2000.
The bottom line of why the planet is warming is the Earth’s Energy Imbalance (EEI). This is the difference between the energy entering from the sun and the energy being reflected and radiated back into space (EEI = Input - Output). An EEI of 0 is a system in balance and keeps temperatures stable. A positive EEI leaves excess energy in the climate system, causing warming and a negative EEI means the planet is loosing energy, causing cooling.
Units are in watts per metre squared (w/m2). The earth has 5.1 E14 m2 so the energy amounts are huge. 1w/m2 has the heating power of 16 ZJ where a ZJ is 10 E21 Joules.
Starting with the input to the climate system, Incoming Solar Radiation - The 2000-2020 trend was slightly negative, this has been tipped to a slight positive overall trend with the latest solar maximum accounting for an extra 0.03w/m2 in 2024 compared to 2000. That’s 0.009% over 24 years, so no, the suns radiation is not responsible for climate change.

Looking at the other half of the equation, energy output, the earth looses heat through two mechanisms, reflection of incoming shortwave radiation and emission of long wave radiation from the warm earth surfaces.
Some of the shortwave radiation from the sun is reflected back into space. This occurs from all surfaces including clouds, snow & ice, land and sea and is called Albedo. Albedo is measured as a percentage, snow & ice has a high albedo, as much as 90% of the shortwave radiation is reflected, whereas blue ocean has a low albedo, as low as 20% is reflected. Different land types and uses result in different albedo, as does pollution, such as soot build up on snow and ice. Airborne aerosol particles such as sulphate emissions from burning fossil fuels also reflect shortwave radiation.
The earth’s albedo has reduced a lot over the period. The shortwave all sky record shows a drop of 1.8% since 2000. This drop is associated with a reduction in global cloud cover of 0.57%, a reduction in snow and ice cover including sea ice which has retreated at both poles, changes to land albedo from expanded agriculture and urbanisation and a reduction in cloud brightness. Clouds are dimming partly due to structural changes believed to be a natural feedback to increased warming and also as a result of reduced aerosol pollution from coal burning, and shipping fuel legislation.3 Sulphate pollution in particular provides aerosols that water droplets can form around within clouds making them brighter.
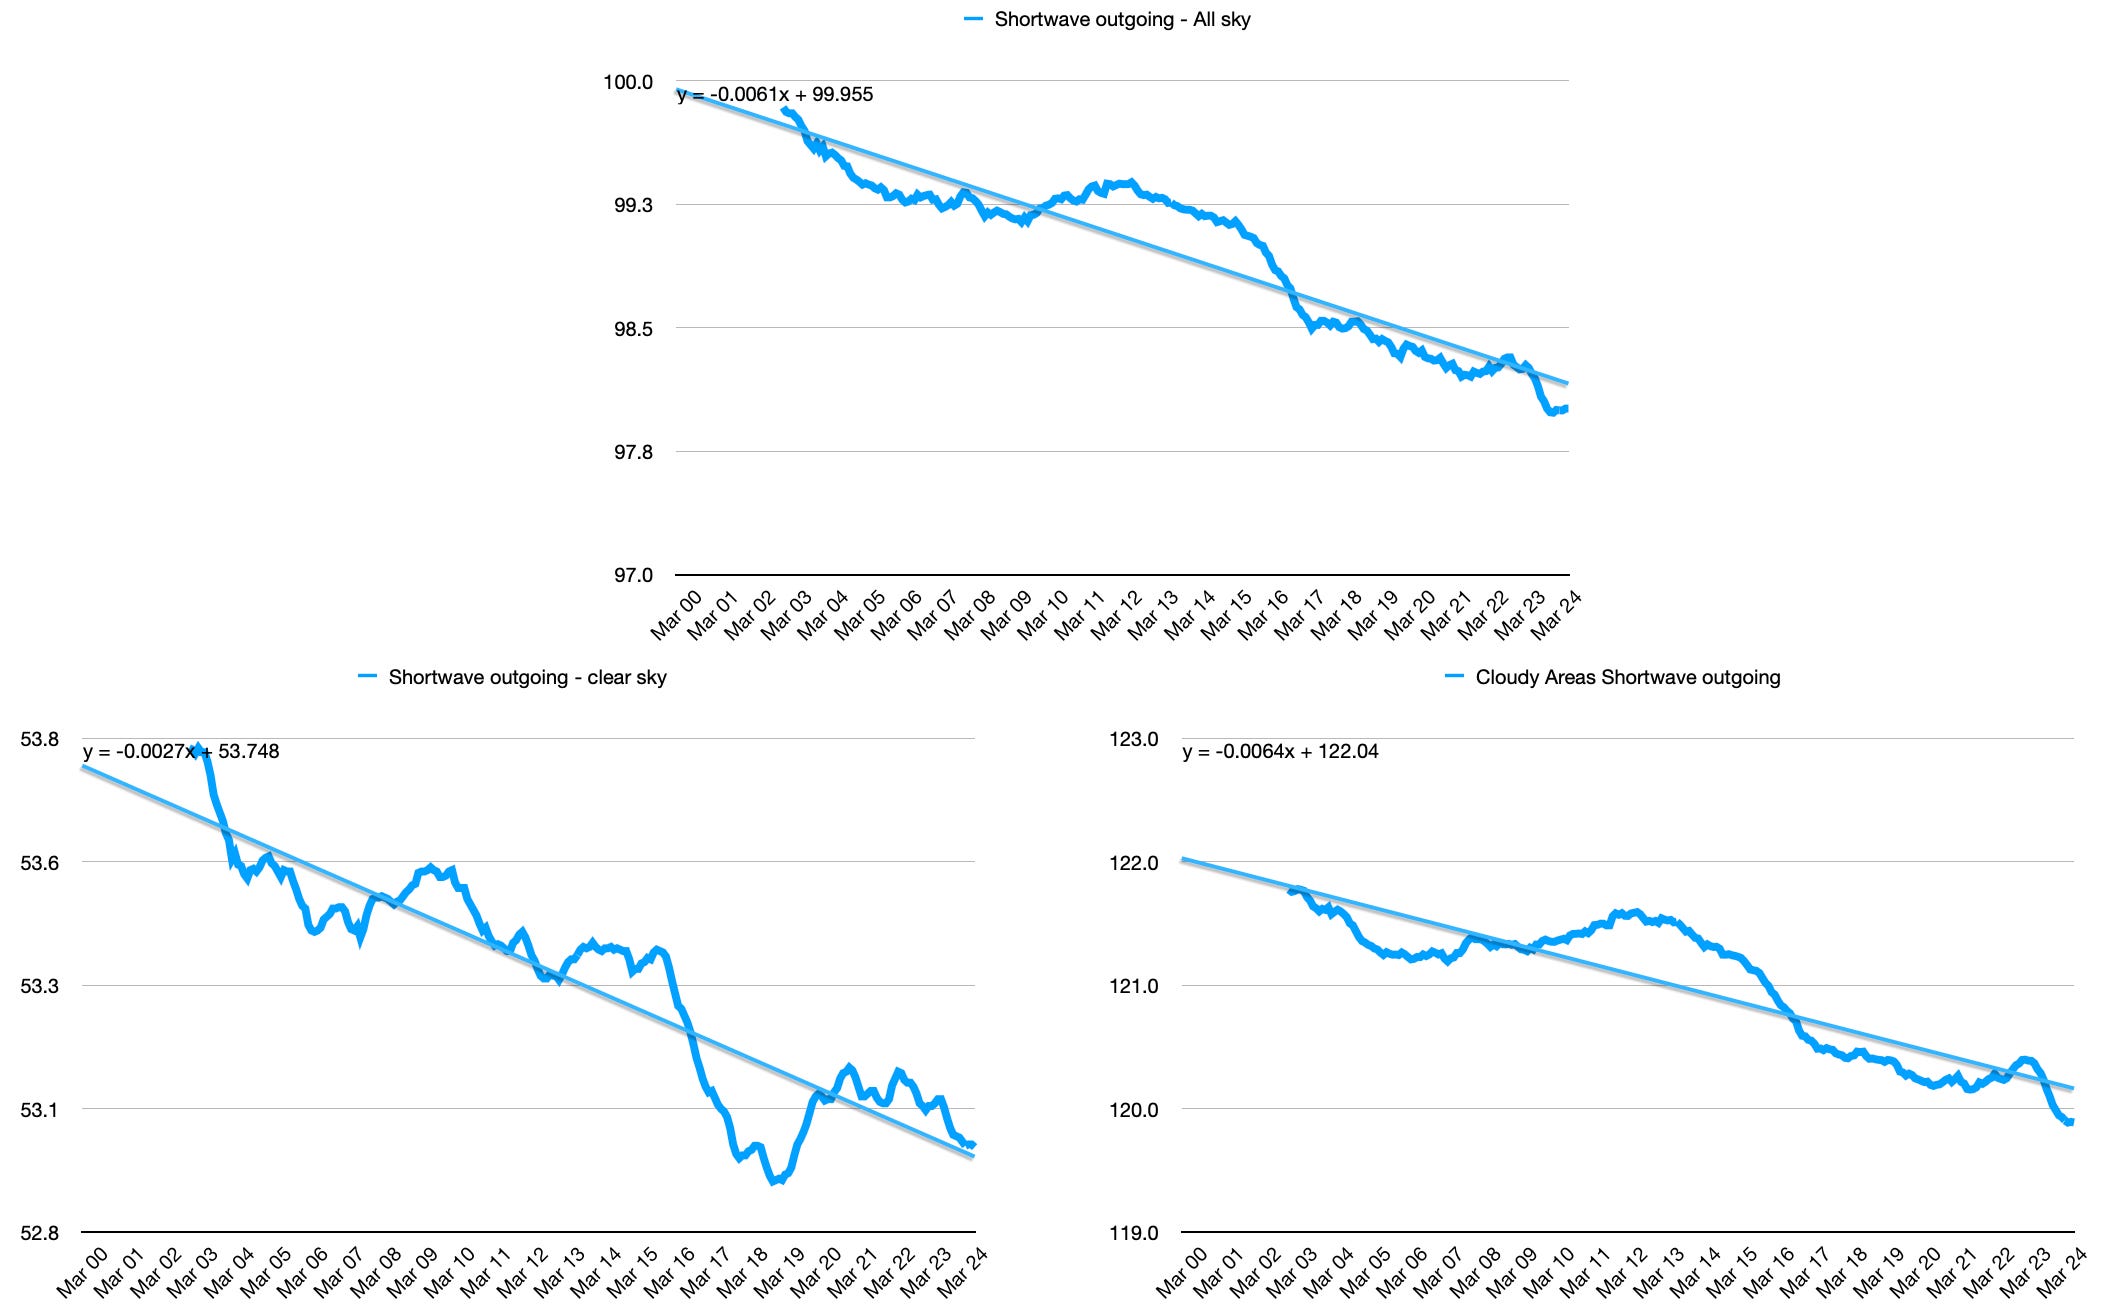
Taken together the reduction in shortwave reflection accounts for 1.8w/m2 of additional heat energy being absorbed by the climate system under all sky conditions.
This additional heat warms the surface of the earth, both the seas and the land. Under Planck’s Law, warmer bodies radiate more as they heat up. The earth’s surface obeys this law and radiates long wave radiation back to space. The all sky long wave radiation has increased by 0.27% or 0.65w/m2 over the period. But here’s the rub, to escape it has to get through the atmosphere, through the green house gases which trap a proportion of the heat.
To explore this process further, the CERES data can be used to separate the long wave radiation through clear and cloudy skies. Although the all sky radiation is increasing as expected from the warming surface, the clear sky long wave radiation, which was increasing in the Dübal and Vahrenholt work, is now dropping, contributing an additional 0.24w/m2 to the EEI.

This reduction of clear sky long wave radiation output is a significant change from the 2000 to 2020 data which was showing a very slight rise. This implies that the accumulation of GHGs in the atmosphere has reached a point in the last decade where the increase in Planck radiation from the additional continuous warming, as measured by sea surface and air temperatures, is being overcome, under clear sky conditions, by GHGs accumulating at a faster rate. Put another way, the accumulation of GHGs is now outpacing the Planck effect’s ability to provide any compensation for further increases in temperature under clear skies.
Under cloudy skies, long wave radiation is still increasing which is driving the overall positive all sky outgoing long wave radiation trend. This is partly because clouds are getting warmer and as a result are radiating more long wave energy themselves. It also suggests changes in cloud structure.

Cloud structure and brightness changes are conceivable since the net flux for cloudy areas is rising faster than the cloud area fraction. The values are negative since cloudy areas exert a cooling effect due to the high shortwave reflection. In 2000 cloudy areas exerted a net cooling effect of -8.4w/m2 but this has reduced to -7.3w/m2 by 2024, despite the increase in outgoing long wave radiation. This is an extremely rapid rise of 15% compared to the clear sky net flux rise of 5.5%.

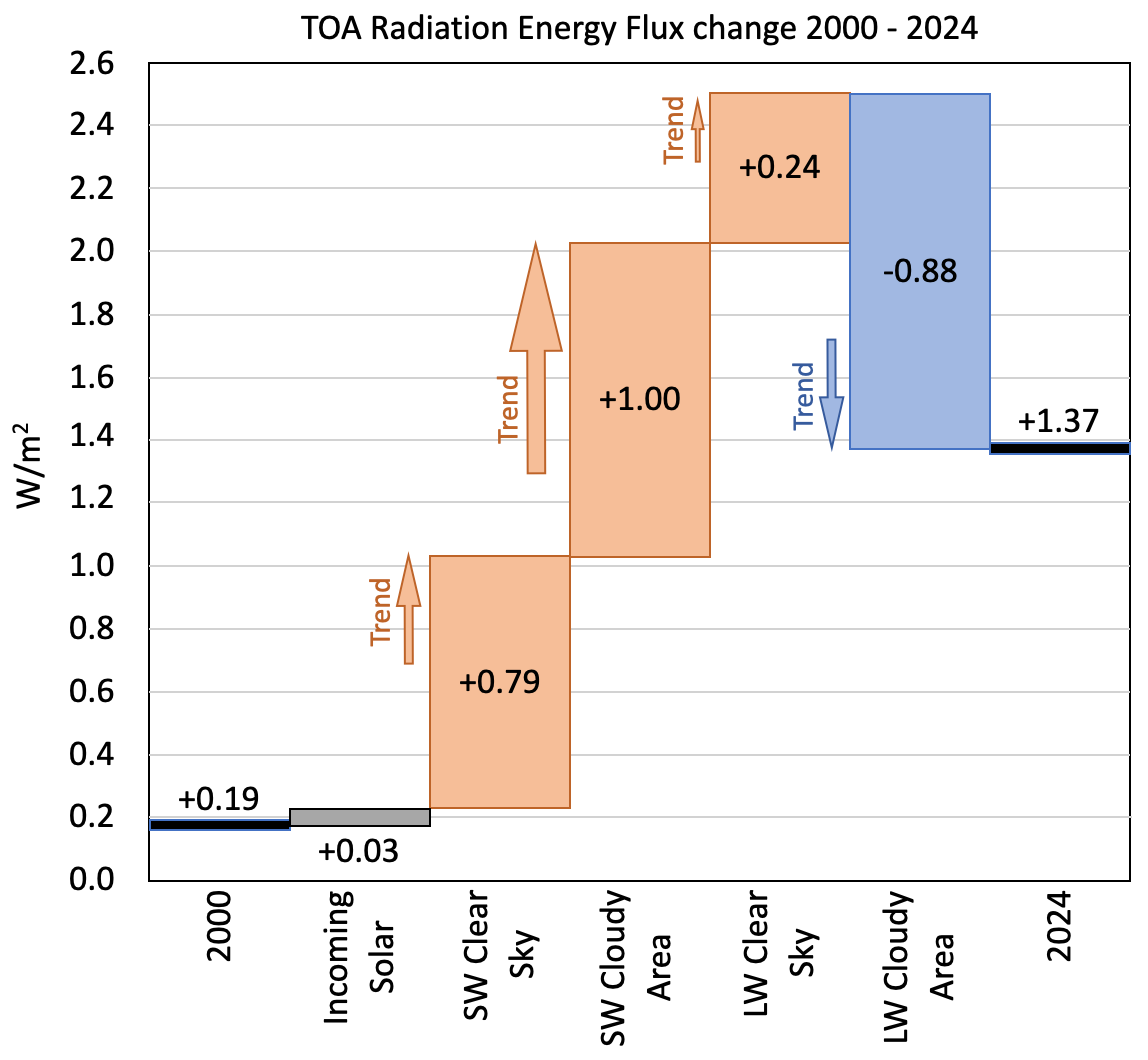
The net result is that overall the EEI has increased from 0.19w/m2 in 2000 to 1.37w/m2 in 2024. To put that into context, over the whole earth this is equivalent to over 1,000,000 Hiroshima bomb’s worth of heat being added to the climate system every day or 12 a second!
The bridge-chart shows the actual changes at the top of the atmosphere from 2000 to 2024, illustrating the start to end change. Trend arrow size represents rate of change.
To summarise each step and its trend:
Incoming solar changes are insignificant and expected to remain so, especially as the solar maximum wains.
Short wave clear sky reflection is reducing thus adding to the EEI. The trend is increasing as albedo decreases and sulphate pollution is reduced.
Short wave cloudy sky reflection is reducing even faster adding more to the EEI. The trend is increasing as the cloud fraction reduces, cloud structure changes and aerosol pollution reduction diminish their brightness.
Long wave clear sky radiation was providing a cooling effect during the first part of the century but has now flipped to providing additional heating. The trend is for this to continue as more and more GHGs accumulate in the atmosphere.
Long wave cloudy sky radiation is the only remaining cooling factor and fortunately is also strengthening as clouds warm. This is not sufficient to compensate for the other factors however.
Under the current trajectories for each of these five factors, EEI will increase by over 60% in the next ten years reaching 2.2w/m2 by 2034. Since the EEI controls the rate of energy accumulation, this will continue to accelerate both global warming itself and the climate change impacts that will result.
The data suggests that if not 2023 or 2024, 2025 will be the middle year in the first 20 year period where the average temperature is 1.5ºC above pre-industrial. The first year above 2ºC will come in the 2030s. The only thing that can prevent this is the reduction of these physical trends.
Dübal, H.-R.; Vahrenholt, F. Radiative Energy Flux Variation from 2001–2020. Atmosphere 2021, 12, 1297. https://doi.org/10.3390/atmos12101297
https://ceres.larc.nasa.gov/data/
James E. Hansen, Pushker Kharecha, Makiko Sato, George Tselioudis, Joseph Kelly, Susanne E. Bauer, Reto Ruedy, Eunbi Jeong, Qinjian Jin, Eric Rignot, Isabella Velicogna, Mark R. Schoeberl, Karina von Schuckmann, Joshua Amponsem, Junji Cao, Anton Keskinen, Jing Li & Anni Pokela (2025) Global Warming Has Accelerated: Are the United Nations and the Public Well-Informed?, Environment: Science and Policy for Sustainable Development, 67:1, 6-44, DOI: 10.1080/00139157.2025.2434494
Thanks Tom! These sound like good points to me. Can you give me your email so that I can add (or invite) you to the HPAC listserv?
Best,
Ron
rpbaiman@gmail.com
Hi Tom,
There’s been an interesting discussion of your substack post on the Healthy Planet Action Coalition (www.healthyplanetaction.org) list of about 230 natural and social scientists, climate activists, entrepreneurs and policy folks (let me know if you’re interested in joining!), and I was wondering if I understood you correctly in the following post?
Your response would be most appreciated!
Best,
Ron
---------- Forwarded message --------- From: Ron Baiman <rpbaiman@gmail.com> Date: Mon, Mar 3, 2025 at 2:52 PM Subject: Re: [HPAC] A breakdown of the trends within the Earth Energy Imbalance (EEI) To: Tom Goreau <goreau@globalcoral.org> Cc: Chris Vivian <chris.vivian2@btinternet.com>, 'Chris Vivian' via Healthy Planet Action Coalition (HPAC) <healthy-planet-action-coalition@googlegroups.com>
Dear Tom, Chris, et al.,
Trying to unpack this statement:
" Cloud structure and brightness changes are conceivable since the net flux for cloudy areas is rising faster than the cloud area fraction. The values are negative since cloudy areas exert a cooling effect due to the high shortwave reflection. In 2000 cloudy areas exerted a net cooling effect of -8.4w/m2 but this has reduced to -7.3w/m2 by 2024, despite the increase in outgoing long wave radiation. This is an extremely rapid rise of 15% compared to the clear sky net flux rise of 5.5%."
It thus appears that the reduction in cloudiness (wherever this has happened) is less of a factor than changes in "cloud structure and brightness" (which appears to be a bigger factor than "cloud warming" caused increases in outgoing LW per the citation above and also this earlier in the piece:
" Clouds are dimming partly due to structural changes believed to be a natural feedback to increased warming and also as a result of reduced aerosol pollution from coal burning, and shipping fuel legislation"
So it seems that "cloud structure and brightness" (due to loss of sulfate aerosols and cloud warming causing a loss of brightening) is a bigger warming factor than the offsetting LW cooling (due to loss of cloud fraction - also partly from loss of sulfate aerosols - resulting in more outgoing LW, and increased LW radiation from increased cloud warming) - if I'm getting this right!
Best,
Ron