
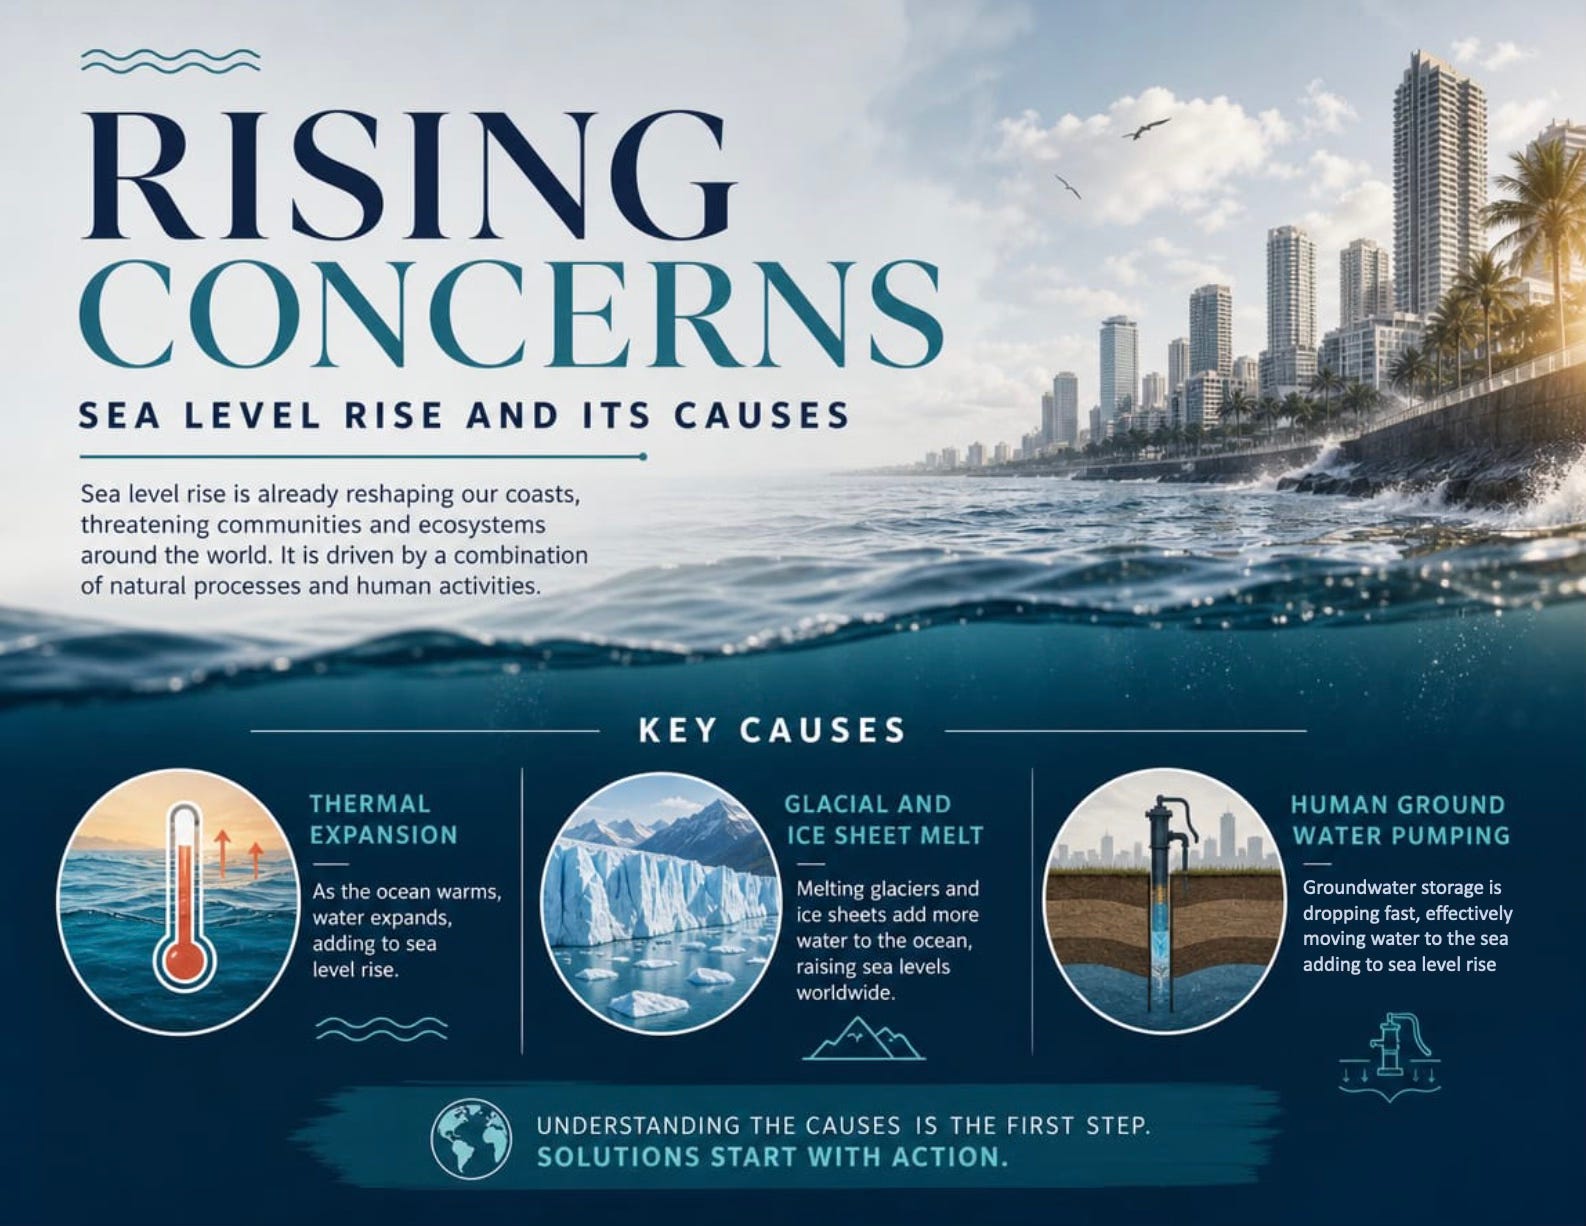
Rising Concerns - Sea Level Rise and its Causes
New studies improve the accuracy of sea level rise budgets while updated projections show future increases for all the contributing factors.

A new study has been published which reduces the uncertainty of the various contributors to sea level rise since 1960.1 The analysis breaks down the contributions of thermal expansion, ice melt and land water storage. The findings, when linked to other recent studies, suggest the rises we should be planning for are, at best, on the high side of previous predictions.
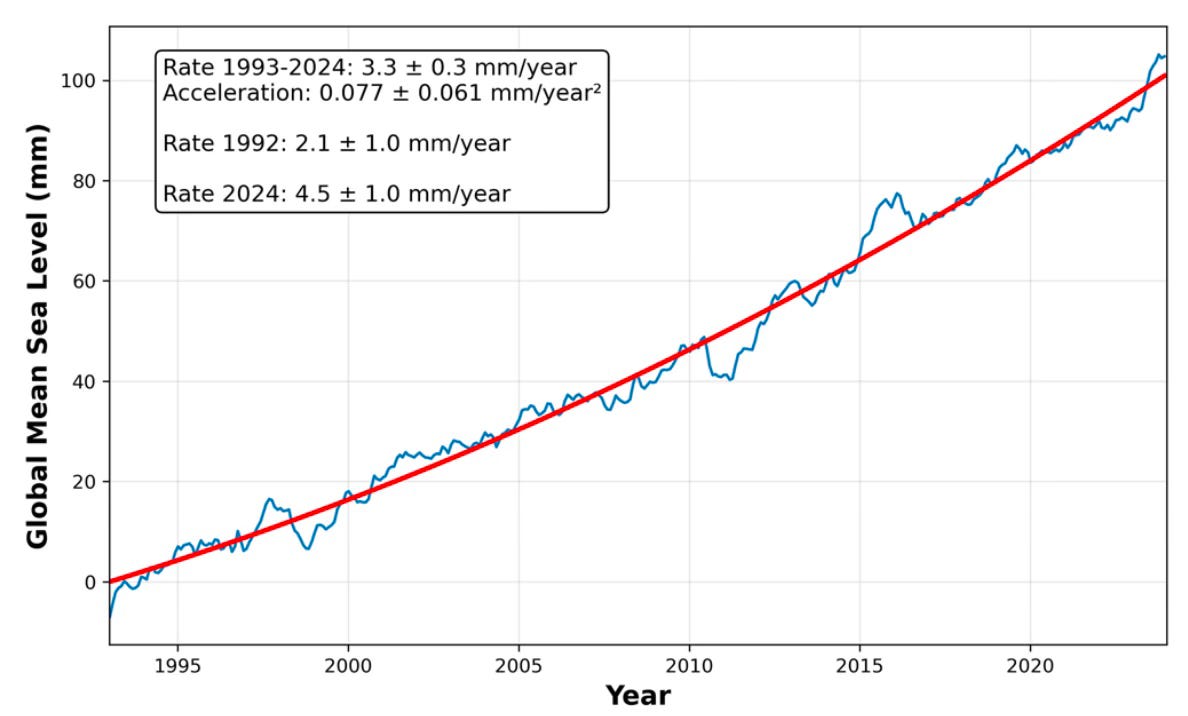
The rate of sea level rise is accelerating, a paper published in 2024 showed that the rate had more than doubled between 1993 and 2024 - the era of satellite measurements of global sea surface height.2 Figure 1 shows the global sea level rise record. The trend curve in red is a quadratic fit indicating the acceleration. The global mean rise is currently 4.5mm per year, and rising.
Contributions to sea level rise
The new study by Huayi Zheng et al. breaks the contributions of sea level rise into six distinct drivers. The largest single contributor is thermal expansion of the ocean water as its temperature increases. The cryosphere provides three contributors in the form of melting ice from Antarctica, Greenland and continental glaciers and snow pack. Land water storage makes the last contributor, and is surprisingly high. Atmospheric water vapour increases, due to the warming air being able to hold more water vapour, has a slight lowering effect.
Thermal Expansion - Thermosteric rise
As water warms, it expands. As we change the climate though our fossil fuel burning and land use changes, the resultant warming affects the seas as well as the air and land, in fact more so. According to von Shuckmann et al. 89% of the energy the Earth is accumulating is being stored in the oceans.3 This is a huge amount of energy, and its being stored as heat. Only 2% of the energy is warming the air where it is now 1.5°C hotter and driving all the extreme weather events which are unfolding.
The total heat gain of the oceans so far this century is over 300 zetajoules (300 with 21 0s after it). What’s more it is being added to at a rate of nearly 10 Hiroshima bombs worth of heat every single second!
The energy comes form the Earth’s Energy Imbalance (EEI), the difference between the incoming solar energy and the outgoing reflected and radiated energy. This is positive and rising, meaning more and more energy is being accumulated at an accelerating rate. Since 89% is stored in the oceans, they are warming and expanding also at an accelerating rate. The 2005-2023 thermosteric sea level rise was 1.55mm/year and shows an acceleration of 0.115mm/year per year.
An interesting recent study by Douville and Allan4 looked at future EEI trajectories and found that even under a very low emissions scenario (SSP1-2.6), EEI is likely to continue to increase until at least the 2040s and not return to zero for centuries. This implies that even a very low emissions scenario will see future thermosteric expansion for the foreseeable future. A more likely scenario such as SSP2-4.5 or the new CMIP7 Medium will see even faster EEI growth with matching thermosteric sea level rise.
Unfortunately it gets worse than that. Although the oceans absorb 89% of the energy, 52% is in the top 700m of the water column. Only 8% has reached the deep layers 2,000m down so far. Ocean currents and mixing will gradually move this heat to the deeper layers where they too will expand. This in turn allows the surface layers to continue to absorb energy and keep warming. This locks in thermosteric sea level rise for centuries to come.
Glaciers
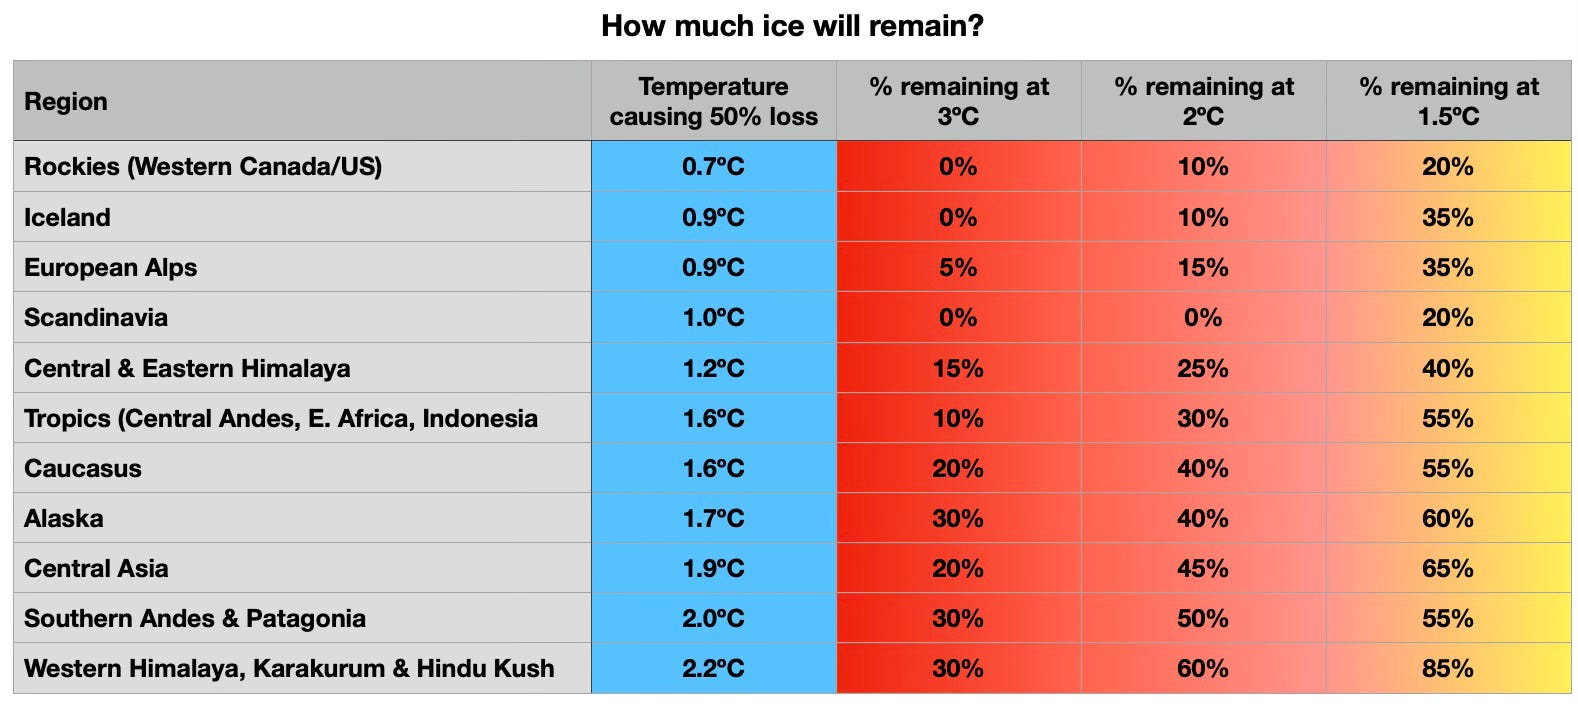
According to the 2025 State of the Cryosphere Report,5 glacier ice loss around the world is increasing exponentially. Between 2000 and 2023, global glaciers outside of the ice sheets in Greenland and Antarctica lost an average of 273 gigatons each year, with ice loss 36% higher in the second half of that period compared with the first. Relative glacier loss was greatest in Central Europe and the Caucasus, which lost 39% and 35% of their ice, respectively, during this time.
The most recent observations are even more alarming. Since 2020, glaciers in Western Canada and conterminous United States have lost 12% of their mass and those in Switzerland 13% - in just 5 years! Not only have Indonesia’s Puncak Jaya glaciers lost more than 99% of their 1850 surface area, but new satellite imagery from 2023 and 2024 shows the tropical ice masses have lost as much as 64% of the remaining surface area since the most recent survey in 2018.
A new paper by Aaron Cremona et al. found that the glaciers in Switzerland lost 25% of their volume between 2010 and 2024. A loss of over 15 cubic kilometres.6
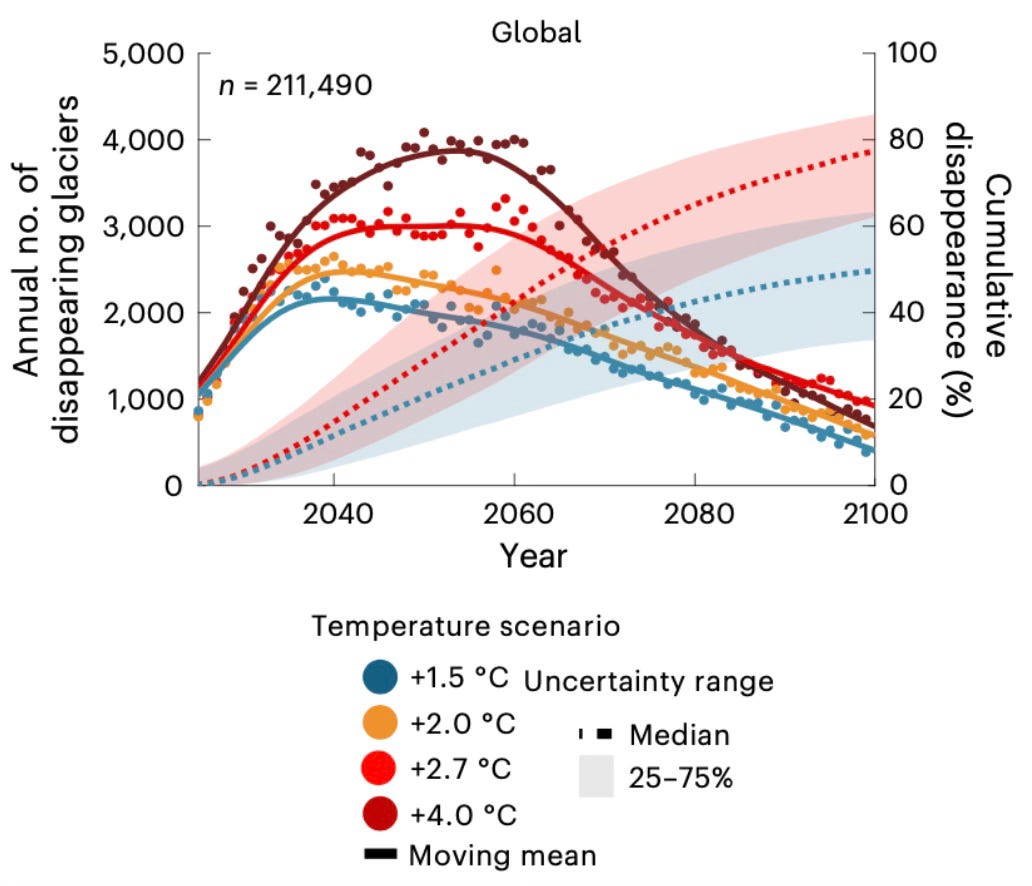
Zheng et al. have glacial ice melt contributing 0.73mm/year to global sea level rise accelerating at 0.014mm/year per year. These prognosis for accelerating melt as temperatures continue to rise suggest this will also increase for decades until they are gone. A study published last year suggested a peak glacial extinction rate could be crossed in the 2040-50s seeing 4,000 glaciers disappear each year.7 The total glacial contribution to sea level rise is therefore set to continue in the short term but level out as the glaciers disappear.
Ice Sheets
The Greenland and Antarctic ice sheets contribute 0.70 and 0.51mm/year of sea level rise respectively. Interestingly the rates for both have slightly slowed during the 2005-2023 period with decelerations of 0.025mm/year per year. The trend had been acceleration since the 1960, but changes in weather patterns creating more snow have slowed the rate slightly.
Although the mass balance loss each year is the direct link to sea level rise, its important to note that the new ice tends to be added to the high altitude ice sheets, while the losses occur within the glaciers that surround the continent. Tipping points are believed to exist for various glaciers within the continents. Winkelman et al. mapped the risks of the Antarctic ice catchment basins predicting tipping temperatures and sea level rise consequences.8

You’ll notice that the system closest to tipping is the Thwaites and Pine Island Glaciers in the Amundsen Sea. Thwaites, also sometimes called the “Doomsday Glacier” is the widest glacier in the world and is held back by a floating ice shelf which is pinned to a grounding line on the sea floor. Unfortunately satellite recognisance is showing that it is just about to break away from this anchor and collapse.9 This will allow the ice shelf to break up and drift off as ice burgs. The lack of buttressing will then allow the land based glacier to flow faster into the sea, accelerating it’s contribution to sea level rise.
Thwaites is already losing mass 5 times faster than it was in the 1990s. One study predicts it could increase its ice loss rate to 180–200 billion tons of ice per year—roughly equal to all the ice Antarctica loses today, by 2067.10
Greenland is no more stable. A 2026 study showed that the Prudhoe Dome ice cap in the northwest of Greenland, currently covered in 500m of ice, was ice free just 7,000 years ago.11 During that time, summer temperatures in the region were only 3°C to 5°C warmer than pre-industrial levels. This is a critical “mild” warming threshold that is close to being experienced today since Arctic Amplification means the region is warming up to 4 times faster than the global average, which is already at 1.5°C. This is important, since if relatively modest warming was enough to erase a 500 meter thick ice dome in the recent past, it suggests that Northwest Greenland is far more sensitive to temperature increases than previously thought, and prone to imminent melting leading to increased and rapid sea level rise.
Terrestrial water storage
As global patterns of precipitation, evaporation, and streamflow change, terrestrial water storage (TWS), which includes all of the surface water, canopy water, soil moisture, and groundwater stored on land, has been shifting rapidly in response. Shifting patterns of TWS threaten water availability and sustainable water management for people and the environment, putting livelihoods and food security at risk, but also contributing to sea level rise.
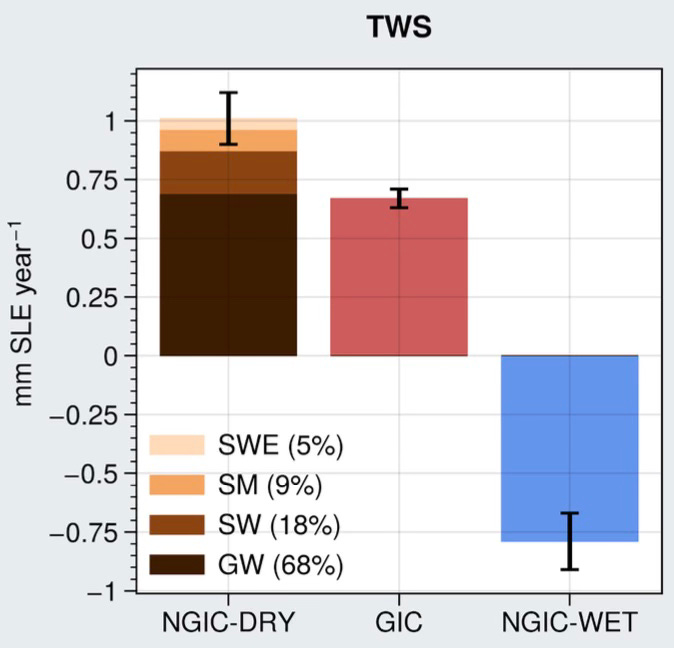
Zheng et al. show losses of ground water accounting for 0.35mm/year of sea level rise. A recent study by Chandanpurkar et al. broke the trends down further to separate non-glaciated drying from wetting since some regions are experiencing increasing rainfall while others are drying.12 They found that not only do the losses from drying regions amount to more than retrieved through wetting areas, but by far the largest contribution (68%) to drying region loss was ground water - the water that we pump out of the ground for crops, industry and consumption. This activity is draining aquifers worldwide and literally pumping it into the sea in massive volumes.
A new study just published examined the ground water storage implications of the observed increase in precipitation concentration into fewer, heavier events on the land water balance.13 They project widespread relative TWS reductions from future rainfall concentration alone, with 50% of the global population experiencing drying, in turn forcing more pumping from aquifers and natural ground storage.
Then we can add data centre expansion. The average data centre uses 1.7 litres of cooling water per kilowatt hour of energy consumed. This suggests freshwater usage in 2024 by data centres was 705 million tonnes. This could increase to 1,600 million tonnes by 2030 and potentially more than 2,000 million tonnes by 2035 as the industry expands AI rollout. If you prefer to think in terms of Olympic swimming pools, that equates to a current usage of 775 pools per day in 2024 increasing to 1,750 a day in 2030 and 2,250 a day by 2035. It may only increase ground water use by ~2%, but it all ends up raising sea levels.
Atmospheric water vapour
As the air warms it is able to hold more water vapour. This is in accordance with the Clausius–Clapeyron relation which holds that for every 1°C of temperature increase, the atmosphere can hold 7% more water vapour. Observations and reanalysis confirm that today’s atmosphere does indeed have a growing specific humidity. This is water that is actually reducing sea levels, but before you get too hopeful, the level is just -0.05mm per year.
Projected rises
There are two aspects involved in predicting future sea level rise and therefore informing adaptation and resilience planning. There is the amount of sea level increase that is already committed to and cannot be avoided, and there is future rise rate that is dependent on the rate of global warming and therefore a combination of our emissions trajectory and the climate’s sensitivity.
The Royal Society published a report where the authors assessed the likelihood of lower IPCC sea-level rise scenarios (SSP1–1.9 and SSP1–2.6) in light of current ice-sheet observations and model limitations, alongside today’s emissions trends and current shortfall of climate commitments.14 They concluded that ‘low-end’ projections may underestimate the true pace and magnitude of future sea-level rise and, if we continue on today’s mid-higher emissions pathway (SSP3–7.0), sea-level outcomes of more than 1m by 2100 should be planned for and that rises of more than 2m this century and several metres thereafter are a real possibility.
Whilst this is the global average, due to currents, gravitational and other effects, regional changes may be even greater. For example an AMOC weakening is believed to cause up to 1m of additional sea level rise in the north Atlantic coastlines on top of the global trend.15 Since the latest research points to a 50% weakening within 75 years,16 coastlines of the eastern US, Canada and northern Europe should be planning for at least a 1.5m rise and considering the risks of over 2m this century.
Deep emissions cuts and scaling of carbon removal could help to shave the peak from these projections, but most of the rise is now unescapable regardless of our actions, so adaptation is key. It is also worth noting that the rise to date has been fairly steady, albeit with acceleration. There are however significant jumps ahead, not least in the form of Thwaites losing its ice sheet buttress. This will be followed by many others around Antarctica and Greenland. The sleeping giants are awakening. There is no time to lose.
This is why organisations such as the Collectif Montée Des Eaux are working so hard to draw peoples attention to, and help France prepare for the inescapable sea level rises to come. They advocate planning and preparing now for 1.2m by 2100 and 1.5m by 2125. Given the weight of evidence, this makes perfect sense.
If you found this article interesting or useful, please tick the ❤️ button as it helps the algorithm point more people in this direction and gives us feedback on what subjects are most useful. Thank you!
Huayi Zheng et al., Improved closure of the global mean sea level budget from observational advances since 1960.Sci. Adv.12,eaea0652(2026).DOI:10.1126/sciadv.aea0652
Hamlington, B.D., Bellas-Manley, A., Willis, J.K. et al. The rate of global sea level rise doubled during the past three decades. Commun Earth Environ 5, 601 (2024). https://doi.org/10.1038/s43247-024-01761-5
von Schuckmann, K., et al. Heat stored in the Earth system 1960–2020: where does the energy go?, Earth Syst. Sci. Data, 15, 1675–1709, https://doi.org/10.5194/essd-15-1675-2023, 2023.
Douville, H., & Allan, R. P. (2026). Constraints on climate change stabilization based on observations of Earth’s energy imbalance. Geophysical Research Letters, 53, e2025GL121056. https://doi.org/10.1029/2025GL121056
ICCI, 2025. State of the Cryosphere 2025: Ice Loss = Global Damage. International Cryosphere Climate Initiative (ICCI), Stockholm, Sweden. 52 pp. https://iccinet.org/statecryo25/
Cremona, A. et al.: Seasonal mass balance drivers for Swiss glaciers over 2010–2024 inferred from remote-sensing observations and modelling, The Cryosphere, 20, 3111–3130, https://doi.org/10.5194/tc-20-3111-2026, 2026.
Van Tricht, L., Zekollari, H., Huss, M. et al. Peak glacier extinction in the mid-twenty-first century. Nat. Clim. Chang. 16, 143–147 (2026). https://doi.org/10.1038/s41558-025-02513-9
Winkelmann, R., Garbe, J., Donges, J.F. et al. Mapping tipping risks from Antarctic ice basins under global warming. Nat. Clim. Chang. 16, 341–349 (2026). https://doi.org/10.1038/s41558-025-02554-0
Goldberg, D. N., Morlighem, M., & Gourmelen, N. (2026). Recent observations of Thwaites Glacier, West Antarctica are consistent with high rates of loss in next 50 years. Geophysical Research Letters, 53, e2025GL118823. https://doi.org/10.1029/2025GL118823
Walcott-George, C.K., Brown, N.D., Briner, J.P. et al. Deglaciation of the Prudhoe Dome in northwestern Greenland in response to Holocene warming. Nat. Geosci. 19, 189–194 (2026). https://doi.org/10.1038/s41561-025-01889-9
Hrishikesh A. Chandanpurkar et al. ,Unprecedented continental drying, shrinking freshwater availability, and increasing land contributions to sea level rise. Sci. Adv.11,eadx0298, 2025. DOI:10.1126/sciadv.adx0298 https://www.science.org/doi/10.1126/sciadv.adx0298
Lesk, C.S., Mankin, J.S. More concentrated precipitation decreases terrestrial water storage. Nature 653, 425–432 (2026). https://doi.org/10.1038/s41586-026-10487-7
Millman H, Siegert MJ, Alley RB. 2026 The achievability of low-emission IPCC sea-level rise scenarios. Phil. Trans. R. Soc. A 384: 20240565. https://doi.org/10.1098/rsta.2024.0565
René M. van Westen et al. Dynamic and steric sea-level changes due to a collapsing AMOC in the Community Earth System Model, Ocean Sci., 22, 1353–1376, https://doi.org/10.5194/os-22-1353-2026, 2026
Valentin Portmann et al. ,Observational constraints project a ~50% AMOC weakening by the end of this century.Sci. Adv.12,eadx4298(2026).DOI:10.1126/sciadv.adx4298 https://www.science.org/doi/10.1126/sciadv.adx4298
Also, after reading your post Tom,I was affirmed we have to seriously consider massive desal strategies to port water back onto and into the land.
Hi Tom,
I live just a couple meters above the high tide in the Pacific Northwest of the US, so I look at the peak tides as a personal risk. Some of the issues you've raised can be mitigated with technology such as the data center heat energy waste and recycled into useable energy rather than dumping more fresh water into the oceans.
Another great, and easy to understand post. Thanks Clif Alferness